
| Basic Research | https://doi.org/10.21041/ra.v15i3.836 |
Experimental behavior of plain concrete under short-term creep in uniaxial compression and its relation to stiffness change
Comportamiento experimental del concreto simple bajo flujo plástico a corto plazo en compresión uniaxial y su relación con el cambio de rigidez
Comportamento experimental do concreto simples sob fluência de curto prazo em compressão uniaxial e sua relação com a mudança de rigidez
B. T. Terán-Torres1 , C. A. Juárez-Alvarado1, J. M. Mendoza-Rangel1, I. Flores-Vivian1, D. Cavazos-de Lira1, R. Hermosillo-Mendoza1, M. D. Bojórquez-Calles1, L. G. López-Yépez1*
1 Universidad Autónoma de Nuevo León, Facultad de Ingeniería Civil, Av. Universidad S/N, Cd. Universitaria, San Nicolás de los Garza, Nuevo León, México.
*Contact author: llopezy@uanl.edu.mx
Received: 05/06/2025
Revised: 07/08/2025
Accepted: 13/08/2025
Published: 01/09/2025
| Cite as: Terán-Torres, B. T., Juárez-Alvarado, C. A., Mendoza-Rangel, J. M., Flores-Vivian, I., Cavazos-de Lira, D., Hermosillo-Mendoza, R., Bojórquez-Calles, M. D., López-Yépez, L. G. (2025), “Experimental behavior of plain concrete under short-term creep in uniaxial compression and its relation to stiffness change”, Revista ALCONPAT, 15 (3), pp. 315 – 334, DOI: https://doi.org/10.21041/ra.v15i3.836 |
Abstract
In this study, specimens were tested under sustained axial compression loads to obtain their short-term creep behavior, i.e., over a period of one hour. The specimens were subjected to various loads (20%, 50%, and 80% of their capacity) at various ages (7, 28, and 90 days), recording the longitudinal and transverse strain over time. Subsequently, the specimens were tested to failure, obtaining the stress-strain curve, compressive strength, and modulus of elasticity. It was found that the specimens subjected to 20% load showed a slight increase in capacity and modulus of elasticity, while those subjected to 50% and 80% loads showed a decrease in capacity and modulus of elasticity for all ages.
Keywords: nonlinear creep, plain concrete, stiffness change, sustained load.
1. INTRODUCTION
Currently, concrete is a fundamental material in the construction industry, thanks to its ease of manufacture, affordability, and adaptability to multiple applications. For this reason, it has been widely used in the construction of various structures, including buildings, bridges, dams, and other civil engineering works. However, its composite nature and quasi-brittle behavior complicate the accurate prediction of its mechanical response to different stresses.
If we focus our attention on the structures listed above, all of them are subject to similar demands, i.e., cyclic loads and sustained loads. For example, in the case of buildings, sustained loads are the result of dead loads, while cyclic loads can be the result of accidental forces such as wind and earthquakes or even the variability of live loads, although to a lesser extent. Particularly in the case of earthquakes, these loads can generate cycles with a high range of stresses (high-cycle fatigue) (>Zhongs and Deierlein, 2019). On the other hand, bridges are subjected to sustained loads resulting from dead load, while live load generates stress cycles (>Zhou and Chen, 2024). Finally, in the case of dams, sustained loads are the result of their own weight and hydrostatic pressure, while cyclic loads are the result of waves caused by earthquakes or wind (>Ouzandja et al., 2023). Therefore, to analyze these and other structures, it is possible to propose constitutive models that can predict the effects of sustained and cyclic loads simultaneously. Unfortunately, most current constitutive models only quantify the decoupled behavior of cyclic and sustained loads (>Terán-Torres et al., 2024). This can be a disadvantage, as it can lead to errors when estimating the remaining life of an existing structure or cause design errors in its initial stage.
In the specific case of bridges, previous research (>Bazant et al., 2010; Bazant et al., 2011) has shown that existing models that only consider the action of sustained loads (creep) tend to underestimate long-term deflections, especially in structures with large spans. This discrepancy has been linked to the interaction between sustained and repeated loads, a phenomenon identified as cyclic creep. To address this issue, Bazant and Hubler (2014) proposed a theory of cyclic creep based on the principles of linear elastic fracture mechanics. The results obtained from this formulation revealed that this combined effect negatively influences the long-term deflection of bridges with intermediate spans between 40 and 80 meters. However, this theory assumes that concrete behaves as a linear elastic material and is not based on a rigorous thermodynamic constitutive approach, which could lead to physical inconsistencies during the structural analysis stage. Consequently, there is a clear need to develop more advanced and representative constitutive models to improve the prediction of these effects.
For this reason, in previous research (>Terán-Torres et al., 2024), a constitutive model was developed to predict cyclic creep, based on constitutive thermodynamic theory, continuous damage mechanics (>Murakami and Kamiya, 1997), and the solidification theory for aging materials (>Bazant and Prasannan, 1989; Bazant and Heut, 1999), which quantifies the change in mechanical properties with age and considers the effects of short- and long-term creep separately by dividing strain into two terms, one viscoelastic and the other as a viscous fluid, respectively. The theoretical model showed potential during its theoretical application, as it is based on fundamental concepts of physics. Likewise, the continuous damage theory allows cracking to be characterized much more closely to the reality of concrete, and with the feasibility of being implemented under cyclic load applications. Furthermore, it is based on a solid mathematical theory, i.e., Volterra integrals equations, which has the advantage of being easily implemented numerically (>Linz, 1985). However, to define the parameters of the constitutive models, tests are required on plain concrete under various load conditions. Specifically, for the constitutive model considered (Terán-Torres et al., 2024), for short-term creep, tests of tension, compression, and pure shear under sustained short-term loading are required.
Similarly, for long-term flow, similar tests are required, but over the long term. Finally, coupled tests are required for the parameters associated with the cyclic creep part.
In previous studies, under sustained compressive loads, it was found that creep strain increases directly with an increase in the level of applied stress and that the use of water-reducing additives had no significant effect on strains (>Collins, 1989; >Neville, 2011). A marked acceleration in microcracking was found when concrete is subjected to stress greater than 50% f'c (>Loo, 1992; >Tang et al., 2020). The effect of relative humidity on creep and shrinkage strains in concrete mixtures has been found to be insignificant. However, the influence of relative humidity on drying shrinkage is definite (>Vandewalle, 2000). Likewise, it was found that specimens that have been completely dried exhibit greater creep than saturated reference specimens (>Tamtsia et al., 2000). >Mazzotti and Savoia (2001, 2002) proved that, at medium stress levels, the stress required to generate creep strain is lower than the predicted limit. They also demonstrated that the Poisson ratio in creep depends on the stress level. >Rossi et al. (2012) demonstrated that creep strain is proportional to the total number of microcracks created in the material. Likewise, the higher the load level, the greater the density of microcracks created. This creation of microcracks during static loading is the origin of creep. >Mei et al. (2017) found that when the load age or load duration is kept constant, its application will reduce the proportion of recoverable creep. This effect on concrete strength becomes greater with increasing load age and gradually decreases with increasing load duration. It has been found that the creep of concrete does not only depend on constant or sustained loads. The strain during the loading process also contains a time-dependent strain component, which cannot be treated as an instantaneous or initial strain, and that the load age, load duration, and concrete strength at load age do not have an obvious influence on the initial recovery coefficient. Furthermore, the initial recovery coefficient decreases when the stress-resistance ratio to load time is increased (>Su et al., 2017; >Chen et al., 2019).
According to the standard ASTM C512 (2002), for creep testing, the recommended ages are 2, 7, 28, and 90 days. Likewise, in other studies, >Iravani and MacGregor (1998) and Zhaozia (1994) performed studies at 28 days; >Mazzotti and Savoia (2002), on the other hand, performed tests at 7, 28, and 60 days; Anker et al. (1998) conducted tests at ages 1, 3, 7, 28, and 90 days, and 1 and 3 years. Finally, ages of 7, 28, 90, and 360 days were considered by >Pan et al. (2022).
Similarly, creep testing is recommended to be carried out at different stress levels (i.e., low, medium, and high). The low level of stress, limited to stresses under 40% of the compressive strength (>Mazzotti and Savoia, 2002), generates strains that do not cause significant damage (cracking). At medium stress levels (i.e., 50% capacity), the number of cracks increases, causing the strain to lose its proportionality. >Pan et al. (2022) conducted tests at several stress levels, including those at the medium level. Finally, for high stress levels, Zhaozia (1994) used stresses of 83, 85, 90, and 95%, and >Shah and Chandra (1970) used stresses of around 60, 70, 80, and 90% of capacity.
This research focuses on the first stage of testing cylindrical specimens under sustained load, in uniaxial compression, to obtain the behavior of the material under short-term creep, i.e., duration of one hour. Based on the above, the cylindrical specimens were subjected to various loads (20%, 50%, and 80% of their ultimate capacity) at different ages (7, 28, and 90 days) to obtain the strain vs. time relationship for longitudinal and transverse strain. After the 1-hour interval, the cylinders were tested to failure to determine the stress-strain curve, their compressive strength, and their respective modulus of elasticity. The research focuses on the tests necessary to attain the experimental parameters for the aforementioned constitutive model for creeps associated with viscoelastic-viscoplastic strain and short-term damage, i.e., the relaxation functions of the material for various stress levels and ages.
2. EXPERIMENTAL METHODOLOGY
2.1 Materials
Portland cement Type CPC 30R, coarse aggregate with a maximum size of 19 mm, and N4 sand in accordance with ASTM C33 (2018) specification were used. The aggregates are limestone typical of the Monterrey region with a relative density of 2.59 g/cm3 and 2. 71 g/cm3 and an absorption percentage of 0.72 and 1.82 for coarse and fine aggregates, respectively. The concrete mix was proportioned using ACI-211 (2022), defining a target strength of f´c = 25 MPa, a strength typically used for conventional structures in the Monterrey, N.L. area. The dry weight dosage of the mixture used for the creep tests per cubic meter consisted of 302 kg of cement, 227 kg of water, 945 kg of coarse aggregate, and 820 kg of fine aggregate.
2.2 Fabrication and testing of specimens
Thirty-six cylinders with a diameter of 150 mm and a height of 300 mm were fabricated for the compression tests, in compliance with ASTM C192 (2024), ASTM C143 (2020), ASTM C39 (2021), and ASTM C617 (2009) standards. Of these, 9 specimens were tested for compression at ages of 7, 28, and 90 days, respectively, as control specimens to determine the compressive strength at those ages. The remaining 27 were tested for creep by sustained compression, 9 specimens were tested at 7 days with a sustained stress of 20%, 50%, and 80% (i.e., 3 specimens for each stress level), 9 specimens were tested at 28 days, and 9 specimens at 90 days, under the same stress levels. Figure 1 shows the specimens produced.
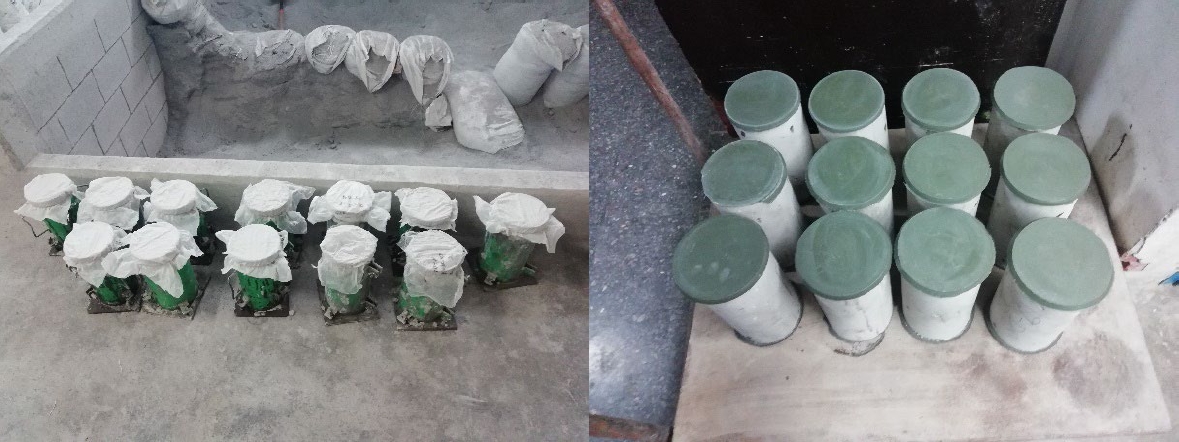
Figure 1. Fabrication and pitching of cylinders 150 mm in diameter x 300 mm in height.
The applied stress was transferred to the specimens by means of a loading frame and a manually operated Enerpac hydraulic jack with a capacity of 100 tons. The compressive load for each specimen was sustained for 1 hour (>Mazzotti and Savoia, 2002), which was kept constant by operating the hydraulic jack throughout the test, ensuring that the variation did not exceed the limits established in ASTM C512 (2002) and in (>Iravani and MacGregor, 1998), as it was a manual mechanism. Longitudinal and transverse strains were measured using four 100 mm stroke linear variable differential transducers (LVDTs) based on the Wheatstone bridge (two Novotechnik TRS model LVDTs for longitudinal strains and two Tokyo Sokki Kenkyujo CDP-10 model LVDTs for transverse strains). It should be noted that, prior to the test, a comparison was made between strain gauges and LVDTs, with the latter giving better measurement results. A PT model HCC-180 load cell with a capacity of 180 tons was used to record the load. Strain and load data were collected using a National Instruments PXIe-1065 data acquisition system. >Figure 2 shows the instrumentation setup for the compression cylinders during the creep tests.
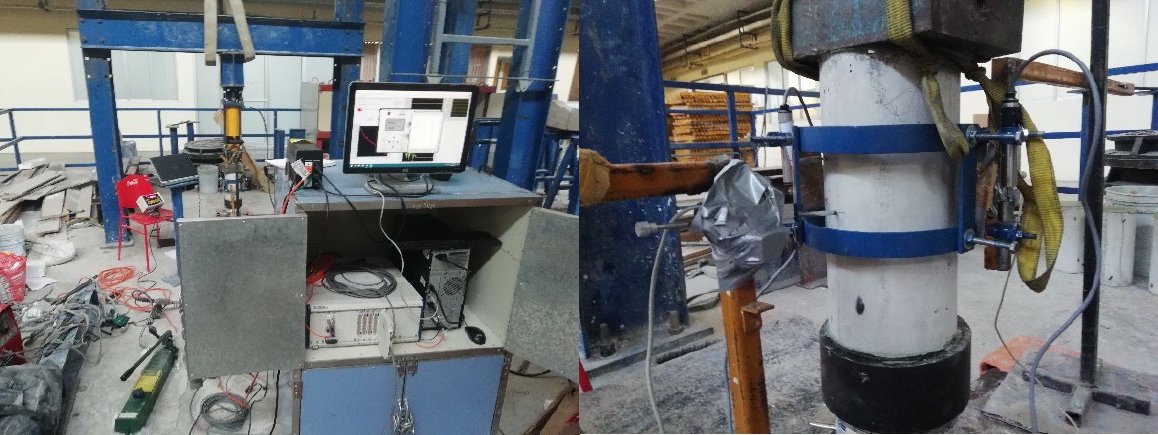
Figure 2. Instrumentation setup for short-term creep tests by sustained compression.
After testing the specimens under sustained compression to determine short-term creep (i.e., 1 hour), the specimens were immediately tested to failure using an Instron model 600DX universal testing machine with a capacity of 60 tons, where the strains were measured using a pair of LVDTs. This was done to measure the degradation of the stiffness of the samples, i.e., through the change in the modulus of elasticity and the compressive strength. The modulus of elasticity was calculated in accordance with ASTM C469 (2014).
3. RESULTS AND DISCUSSION
3.1 Experimental results of creep under sustained compression
Based on the experimental methodology described above, results were obtained for the different ages and stress levels considered. First, Figure 3 shows the average stress percentages applied to specimens at various ages. Likewise, for the 7-day-old specimens, under stress levels of 20% of their compressive strength, an average longitudinal strain of 1.2x10⁻⁴ was obtained, which was the strain obtained until the required stress level was attained. After one hour, the longitudinal strain was measured at 1.42x10⁻⁴. Similarly, the average transverse strain was 3.2x10⁻⁵ and 3.5x10⁻⁵ when the stress level was reached and after one hour, respectively. Similarly, for the stress level of 50% of the compressive strength, the longitudinal and transverse strains recorded at the start and end of the test were in the order of 2.24x10⁻⁴, 3.84x10⁻⁴, 9.9x10⁻⁵, and 1.09x10⁻⁴, respectively.
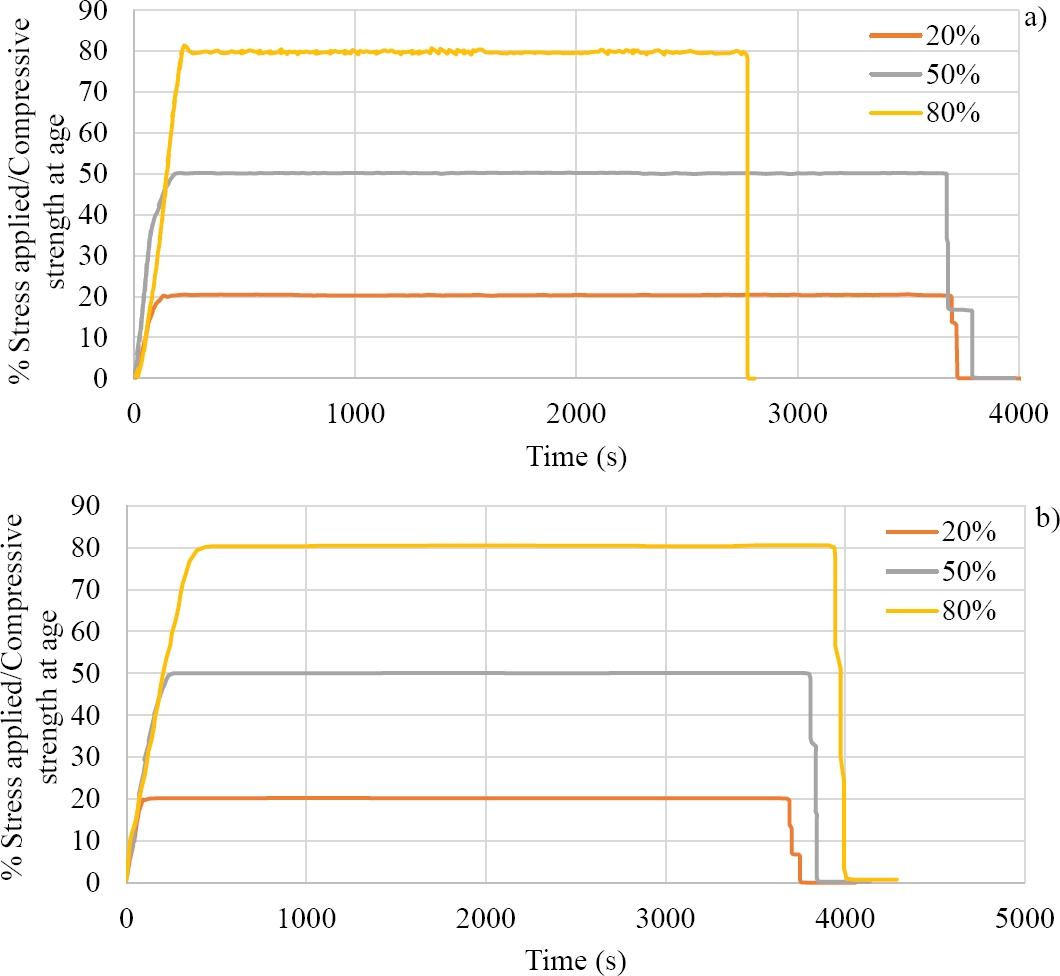
Figure 3. Percentage of stress applied vs. compressive strength at various ages, a) 7 days, b) 28 and 90 days.
For the age of 7 days and sustained compression of 80% of capacity, >Figure 4 shows the average longitudinal strain. As shown in the figure, the specimens failed under tertiary creep during the test time, which is consistent with (>Shah and Chandra, 1970), where it was found that for early ages, specimens fail due to tertiary creep when subjected to high stress levels. The graph is consistent with those under tertiary creep (Shah and Chandra, 1970). The graph shows an acceleration in the strain rate once the specimen has reached a strain of approximately 2x10⁻³, due to the internal accumulation of cracks in the specimen. The specimen fails at approximately 2750 seconds, i.e., approximately 45 minutes after the start of the test. It is important to mention that it was not possible to determine the transverse strain, as the instrumentation failed during the test and there was high variability in the transverse strain. >Figure 5 shows the behavior of longitudinal and transverse strains for low and medium stresses at 7 days of age.
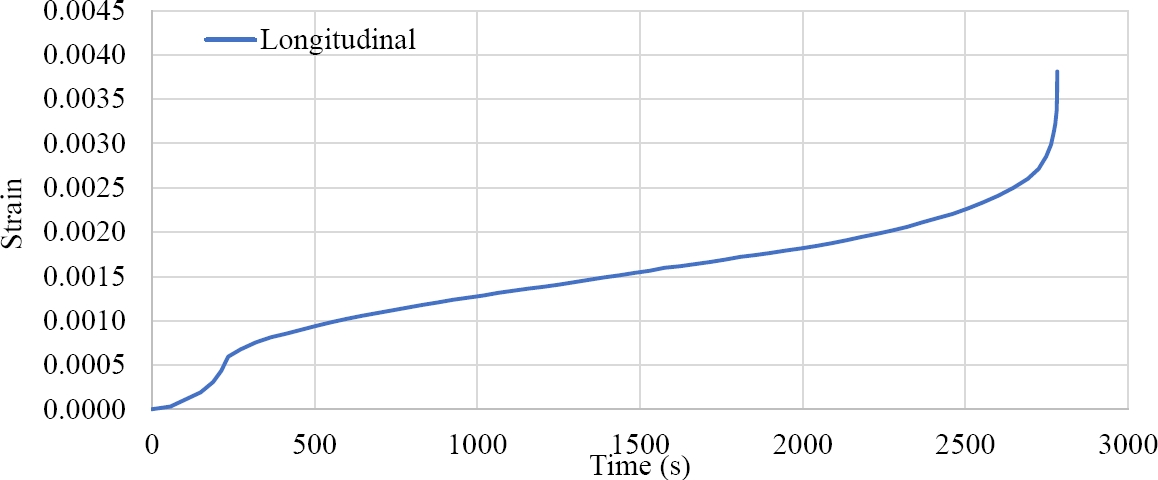
Figure 4. Temporal longitudinal strain in specimens with an age of 7 days, subjected to a sustained compressive load of 80% of their capacity.
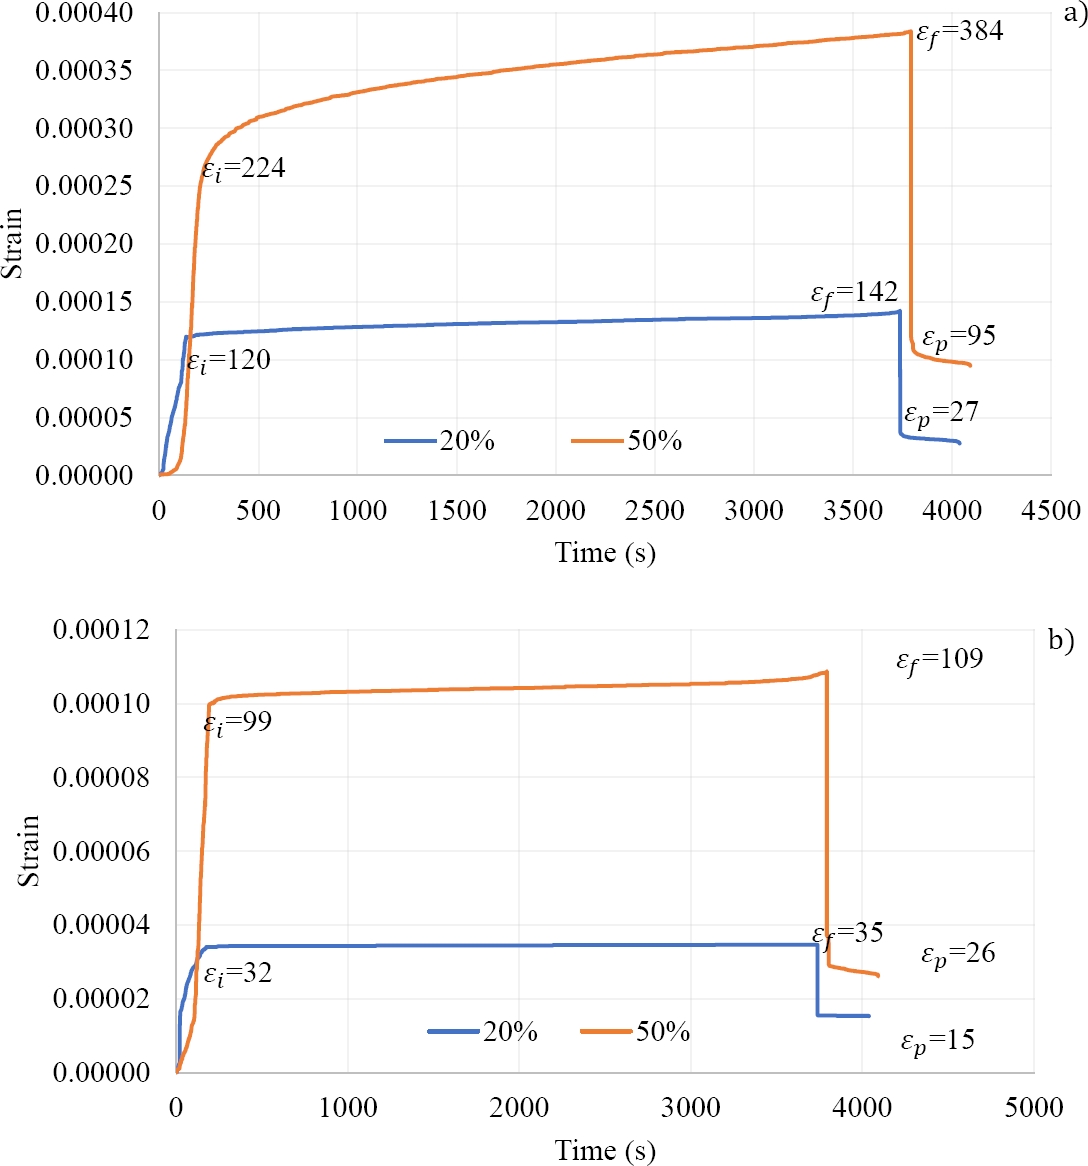
Figure 5. Comparison between the temporal strain for the 7-day age and the stresses of 20% and 50% of capacity, a) longitudinal strain, b) transverse strain.
Similarly, at 28 days of age, particularly at low stress levels, strains of the order of 8.3x10⁻⁵ and 8.8x10⁻⁵ were observed for longitudinal strain at both the start and end of the test, while transversely, the measured strains were of the order of 1.7x10⁻⁵ and 2.0x10⁻⁵, for the start and end of the test, respectively. For medium stress, the longitudinal strain was of the order of 1.97x10⁻⁴ and 2.33x10⁻⁴, while the transverse strain was of the order of 6.7x10⁻⁵ to 7.5x10⁻⁵, for the start and end of the test, respectively. Figure 6 shows the behavior of longitudinal and transverse strains for low and medium stresses, for an age of 28 days.
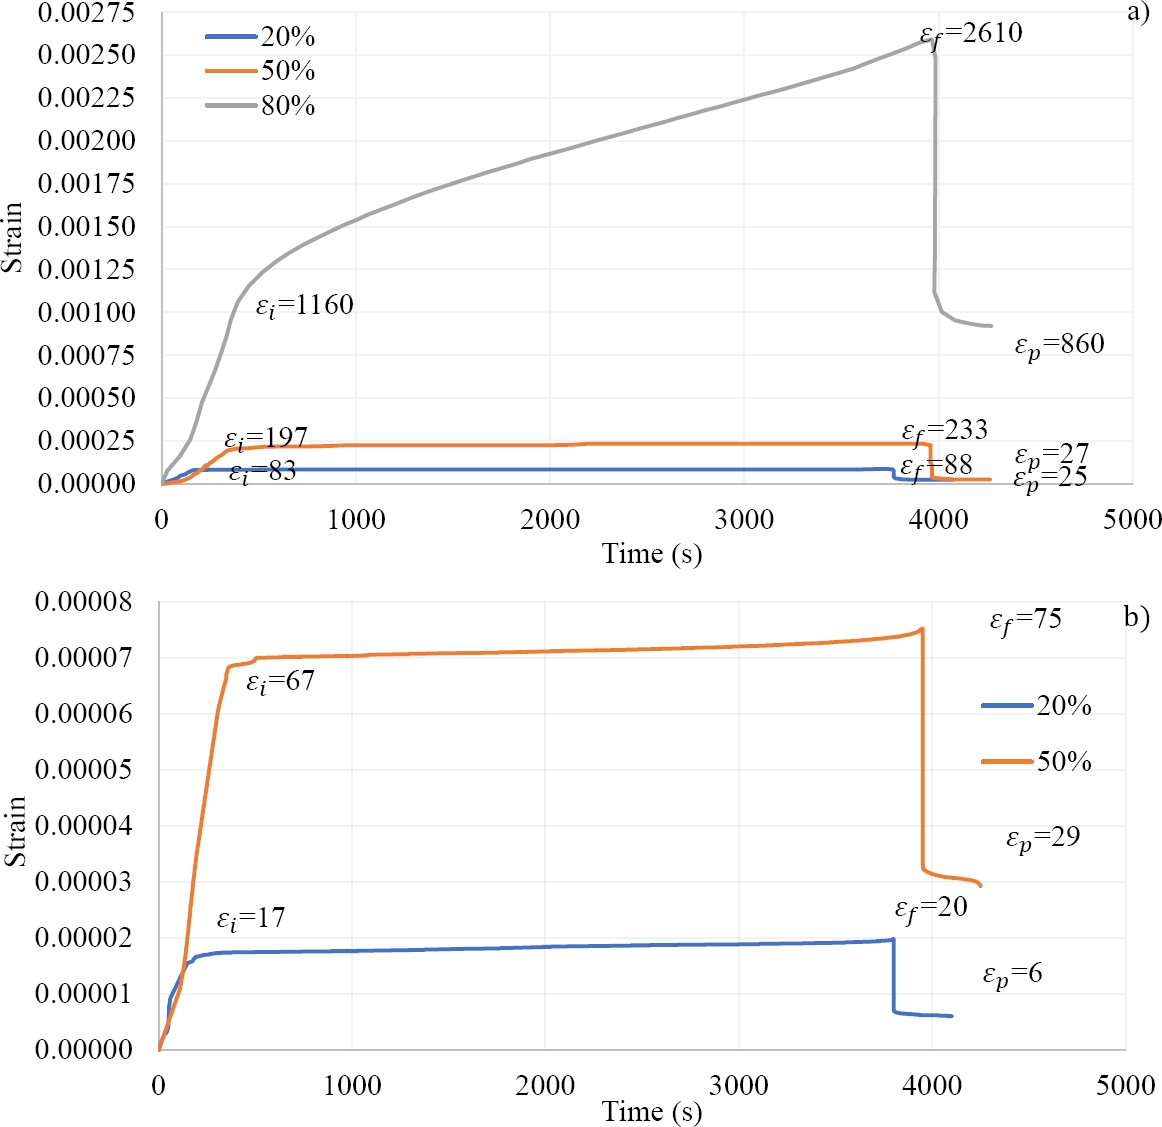
Figure 6. Comparison between the temporal strain for the age of 28 days and the stresses of 20%, 50% and 80% of the capacity, a) longitudinal strain, b) transverse strain.
On the other hand, Figure 6a shows the behavior of the average longitudinal strain for an age of 28 days and high stress levels. It shows that the initial strain is of the order of 1.16x10⁻³, while at the end of the test a longitudinal strain of the order of 2.61x10⁻³ was reached. It can also be seen that the strain rate increases slightly when a strain of 2.43x10⁻³ is reached. This trend is similar to that in Figure 4, indicating that the specimens may have reached an initial stage of tertiary creep. As with the 7-day age, the average transverse strain could not be determined due to a failure in the instrumentation during the test, in addition to high variability in the data.
Finally, for specimens aged 90 days, for low stresses (20% of capacity), longitudinal strains in the range of 5.2x10⁻⁵ and 5.9x10⁻⁵ were found for the start and end of the test; transversely, strains in the range of 1.3x10⁻⁵ to 1.4x10⁻⁵ were found. For medium stress, in other words, 50% of their capacity, longitudinal strains of 1.69x10⁻⁴ and 2.03x10⁻⁴ were found, and transversely, strains of 5.4x10⁻⁵ to 6.4x10⁻⁵ were found. For this age and for stress levels of around 80% of their capacity, the longitudinal strains recorded were in the range of 7.88x10⁻⁴ to 1.22x10⁻³, and transversely, strains with values between 5.04x10⁻⁴ and 6.06x10⁻⁴ were found. Figure 7 shows the temporal longitudinal and transverse strains for the age of 90 days and for the three stress levels.
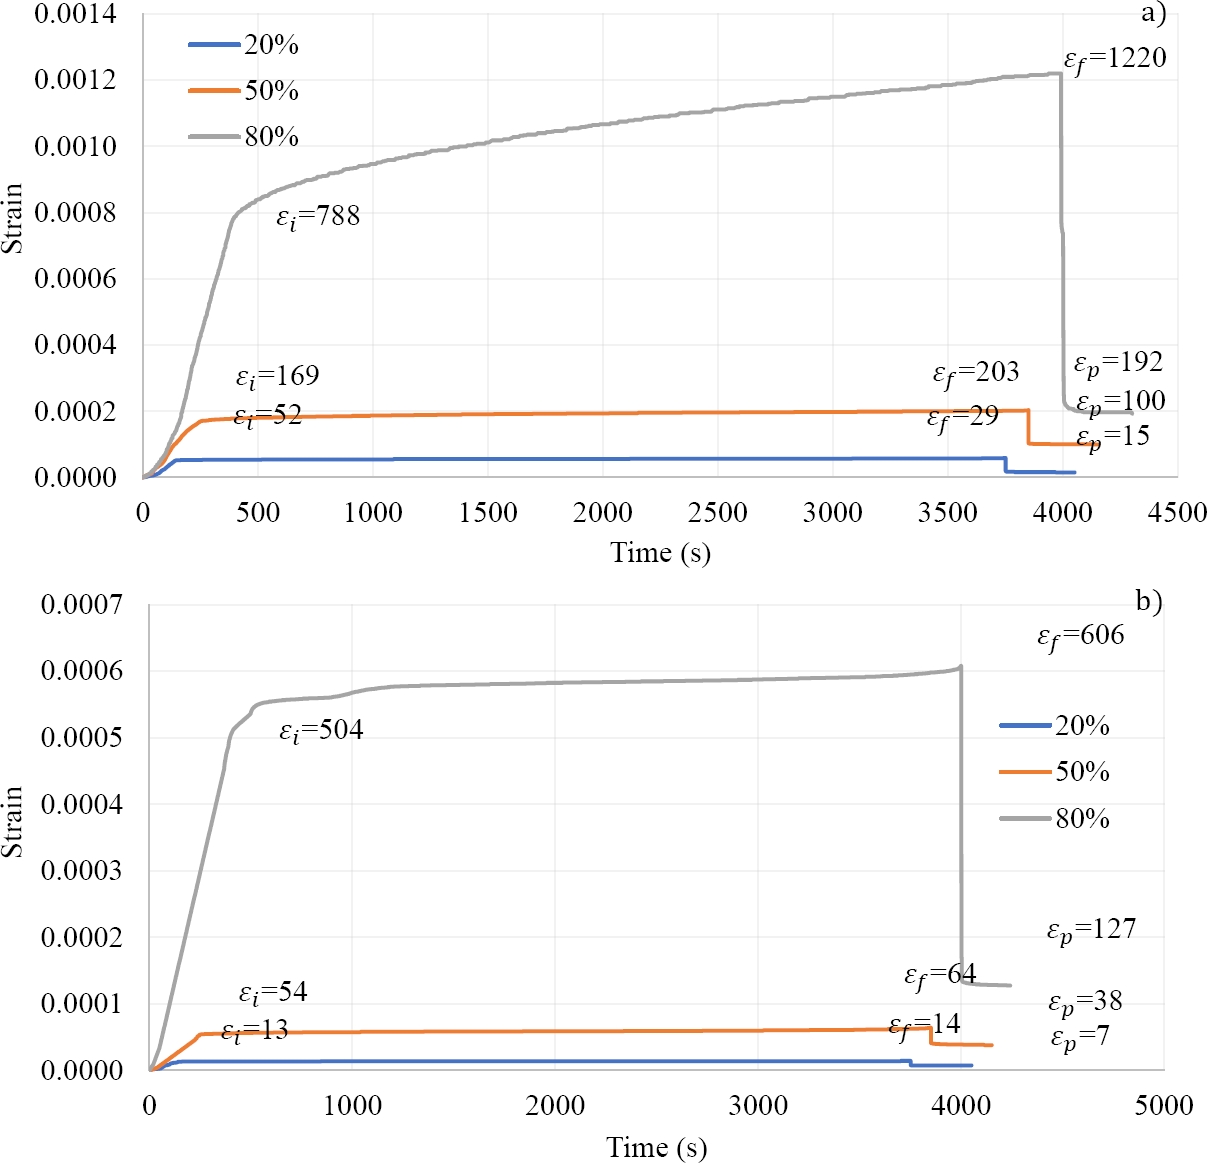
Figure 7. Comparison between time strain for the 90-day age and stress levels of 20%, 50% and 80% of the capacity, a) longitudinal strain, b) transverse strain.
3.2 Experimental results comparison under creep by sustained compression
In order to better understand the behavior of longitudinal and transverse strains over time for the different ages and stress levels, it was decided to present the results by means of a comparison, first, by setting the age and varying the stress levels and, subsequently, by setting the stress levels and varying the age. In the following figures, represents the initial strain upon reaching the desired stress level, indicates the strain at the end of the test, and represents the residual strain upon unloading the specimen.
>Figure 5a shows a comparison of the average longitudinal strain, for the age of 7 days and the stress levels 20% and 50% of their compressive strength, while >Figure 5b shows the comparison for the transverse strain. It is important to mention that the comparison with the high stress levels (80% of its capacity) was omitted since the specimens failed during the test due to tertiary creep. In >Figure 5a, it is observed that the longitudinal strain at reaching the test load for the medium stress level is 1.86 times greater than that recorded for the level of 20% of its capacity; likewise, the longitudinal strain at the end of the test, for the medium stress level is 2.70 times greater than that recorded for the low level, this indicates an increase of 45.16% due to the increase in the strain rate. Moreover, it is visible that the strain rate is higher for that of the medium level than for that of the low level. This is due to the lack of proportionality (non-linearity) in the creep when the limit of 40% of the capacity is exceeded, stress for which micro-cracks in the concrete start to appear internally. This has been recognized by many researchers in the field of creep (>Pan et al., 2022). However, this phenomenon is not reflected for transverse strain, where the ratio of transverse strain, in other words, , both for the beginning and end of the test, is of the order of 3.10, maintaining the mentioned proportionality. Finally, it is important to note that both figures show permanent strain, which is present regardless of whether it is below 40% of the stress magnitude. This has been previously observed in other investigations (>Mazzotti and Savoia, 2002; Pan et.al., 2022). It is important to note that, since this limit was exceeded for the medium levels, permanent strain must be associated with the cracking level of the material (>Rossi et al., 2012).
>Figure 6a shows the comparative longitudinal strains for low, medium and high stress levels (20%, 50% and 80%, respectively), while >Figure 6b shows the transverse strains for low and medium stresses, for specimens aged 28 days. In similarity, it was found that the initial longitudinal strain for the medium level is 2.37 times that recorded for the low level, while the final strain is 2.65 times, this represents an increase of 11.81%, due to the increase in the strain rate that occurs for stresses higher than 40% of the capacity. It is important to note that this increase is lower in comparison with specimens aged 7 days. This is mainly due to the hardening acquired by the change in age, since it is known that as concrete ages, it becomes less susceptible to creep (>Bazant and Prasannan, 1989). Similarly, we compared high level with medium level, where at the beginning the strain for the high level is 5.89 times higher and for the end it is 11.22 times higher, this represents a 90.5% difference from the beginning to the end, due to the increase in the strain rate.
>Figure 7 shows the comparison of longitudinal and transverse strains for specimens aged 90 days, considering the variation of sustained compressive stress levels, i.e. 20%, 50% and 80% of their capacity. For the initial longitudinal strain, it is found that the strain for the high level is 4.66 times greater than that of the medium level, and 15.15 times that of the low level, while that of the medium level to that of the low level is of the order of 3.25 times. For the final strain, it is found that, for high levels, the strain is 6.01 times greater than that of the medium level, for high to low stresses it is of the order of 20.68 times, and for medium to low stresses it is of the order of 3.44 times. The above indicates the change between initial to final strain is 28.97% from high to medium, 36.5% from high to low, and 5.85% from medium to low. It is important to note that the difference between the strain rate from 28 days to 90 days for the medium to high ratio is 3.12 times at the end of the test (percentage ratio, i.e., 90.5/28.97). The above analysis can be replicated for the transverse strains shown in >Figure 7b.
The strains for a fixed stress level are now compared with age variation in order to verify the decreasing susceptibility of concrete to creep as it matures with age (>Bazant and Prasannan, 1989). First, >Figure 8 presents the behavior of longitudinal and transverse strains for the low stress level, i.e., 20% of capacity, with age variation. If we obtain the strain ratios from lower age to higher age we find the difference between them. For example, the age strain ratio from 7 days to 28 days, i.e., , we find that for the initial longitudinal strain is 1.45, while the final strain ratio is 1.61, indicating a change of 11.03% from the final to the initial. Similarly, the ratio between ages 7 to 90, we find that the initial strain at 7 days is 2.31 times greater than that at 90 days, while for the final ratio it is 2.41 times, i.e., an increase of 4.33%. Finally, the initial strain at 28 days is 1.60 times greater than that at 90 days, while the final strain is 1.49 times greater, showing a decrease of 6.88%. By observing >Figure 8, it is evident that the strain rate decreases as age increases, consistent with what was previously described.
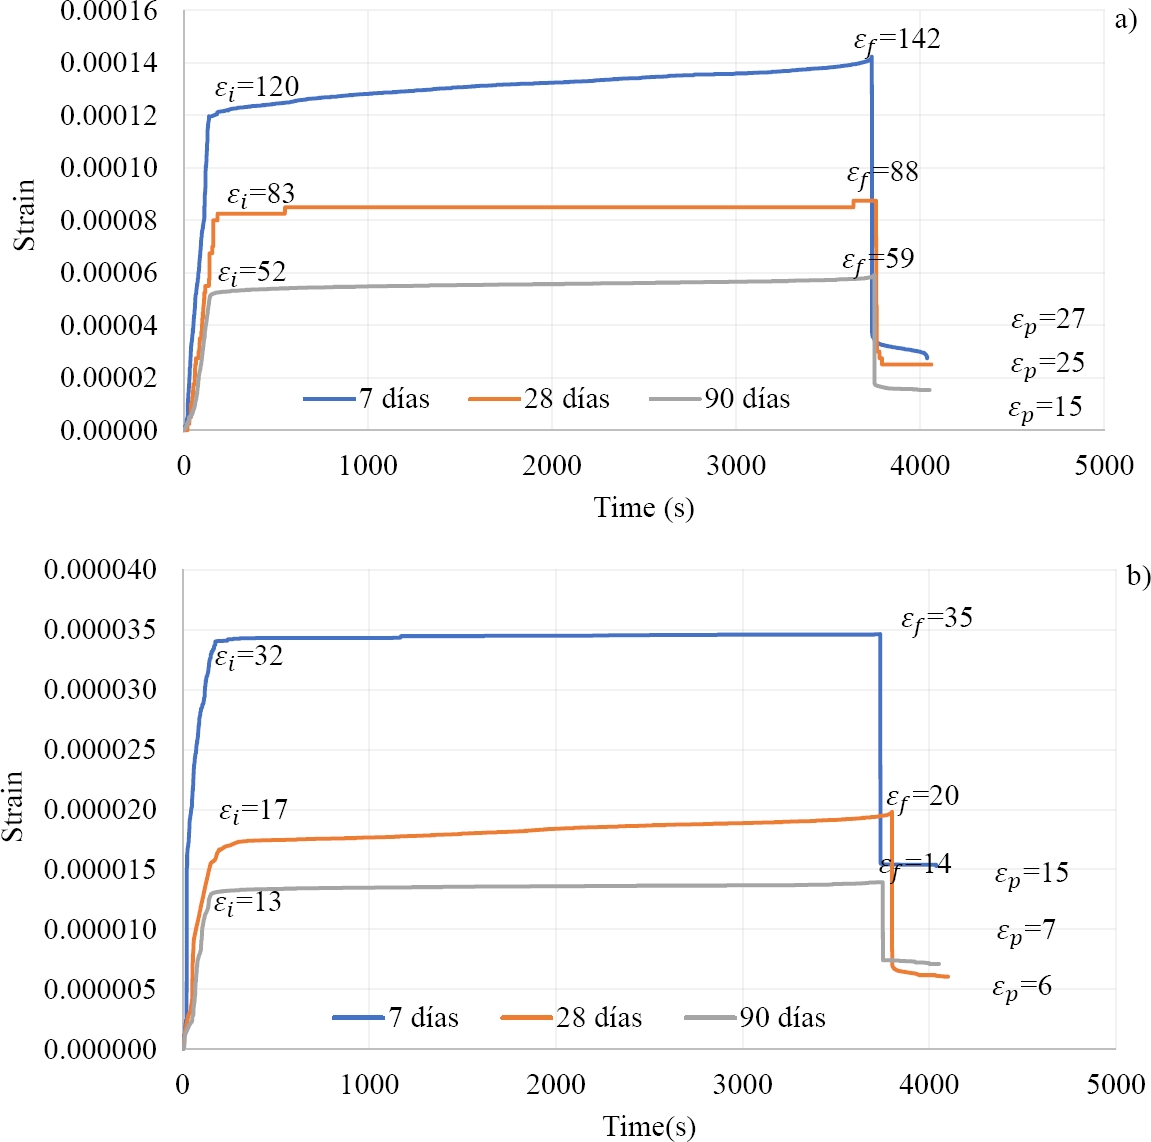
Figure 8. Comparison between the temporal strain for the low stress level (20%), for ages 7, 28 and 90 days, a) longitudinal strain, b) transverse strain.
Furthermore, Figure 9 shows the comparison of the longitudinal and temporal time strain for medium stress level, varying the ages. It is observed that the initial longitudinal strain at 7 days is 1.14 times greater than that present at 28 days, while for the final strain it is 1.65 times greater, indicating an increase of 44.74% greater, due to the non-linear creep range previously mentioned. However, if we now compare the strains for 7 and 90 days, we find that the initial strain is 1.33 times greater, while the final strain is 1.89 times, showing an increase of 42.11%. Finally, the ratios for 28 to 90 days are 1.17 and 1.15 times greater, for the initial and final, respectively. It is important to mention that the comparison of the high stress levels could not be carried out because the specimens failed during the creep test.
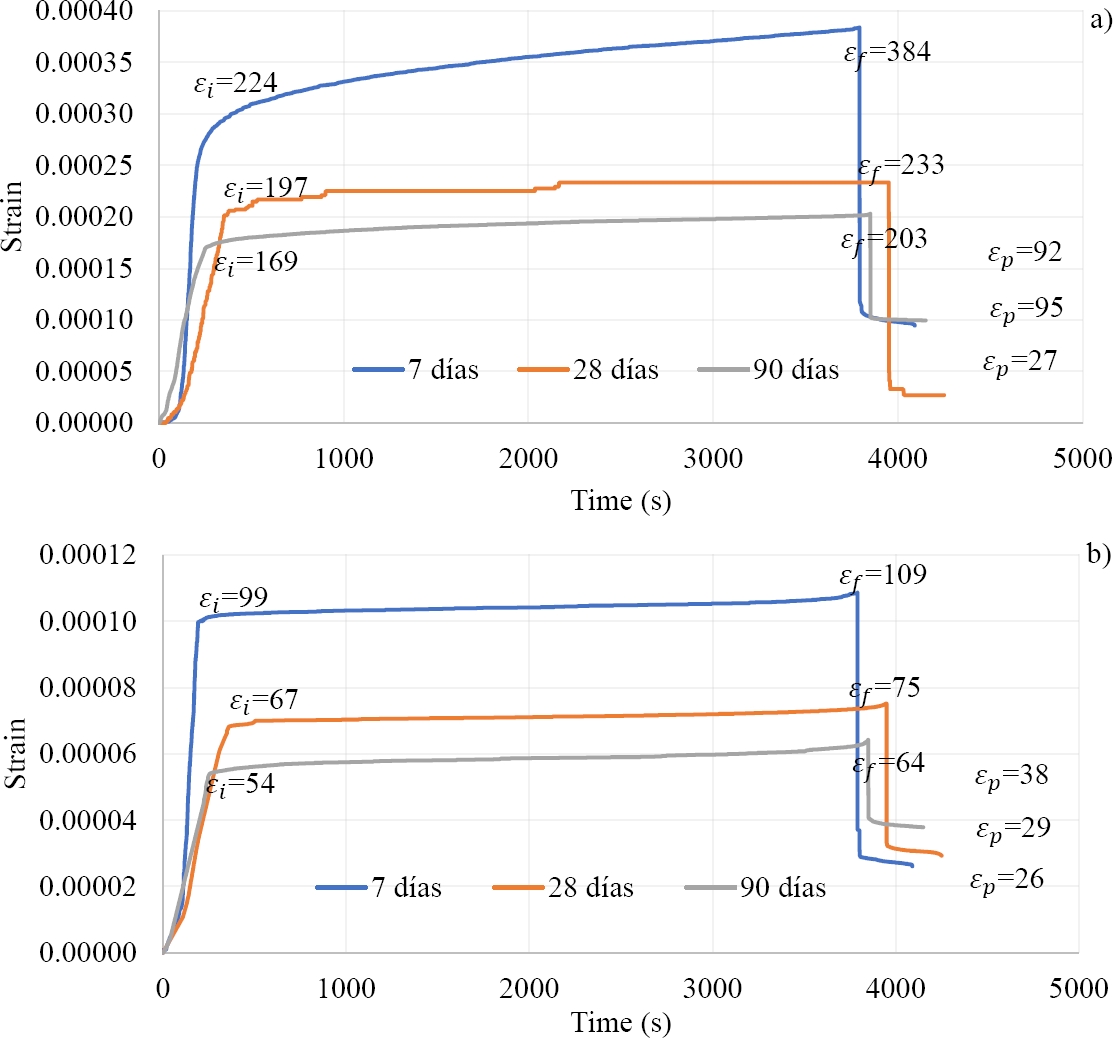
Figure 9. Comparison between the time strain for the average stress level (50%), for ages 7, 28 and 90 days, a) longitudinal strain, b) transverse strain.
Finally, Figure 10 shows the comparison for the high stress level, with age variation. Primarily, it is easily noticeable the difference in strain rate, where it is shown that the slope of the curve for the 28-day curve is notably higher than that for the 90-day curve. The lower to higher age strain ratio, i.e., for this case is 1.42 at the beginning, while at the end it is 2.14. This analysis indicates the nonlinearity or nonproportionality of the concrete, but this time under the change of aging.
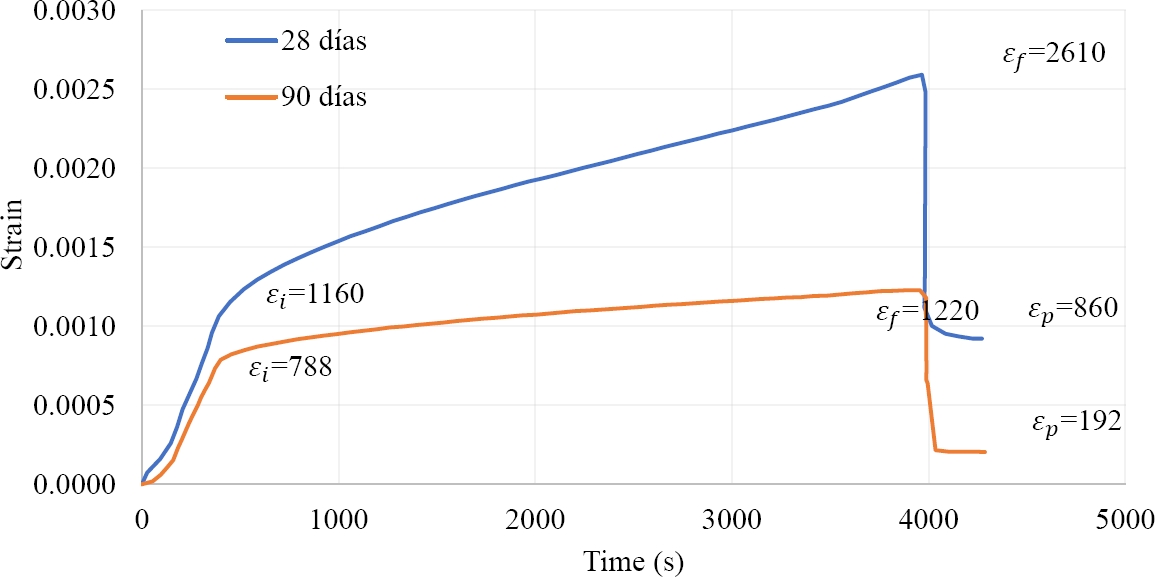
Figure 10. Comparison between the temporal longitudinal strain for the medium stress level (80%), for ages 28 and 90 days.
3.3 Variation in compressive strength, modulus of elasticity, and loss of stiffness due to damage
Figure 11 provides a comparison of the stress-strain plots for the various ages with the variation of the sustained stress level. In all figures the control specimens are represented by the blue line. It is evident that, for all specimens loaded in sustained compression at low stress levels, there is a tendency to slightly increase their compressive strength, whereas, for specimens loaded in sustained compression at 50% and 80% of their compressive strength, there is a loss of capacity associated with the internal cracking suffered. Although less noticeable, this behavior is also reflected in the modulus of elasticity, where specimens loaded at 20% of capacity exhibit a slight increase in the modulus of elasticity, while specimens under sustained loading at medium and high levels, their modulus of elasticity decreases. Table 1 provides the values of strength and modulus of elasticity obtained.
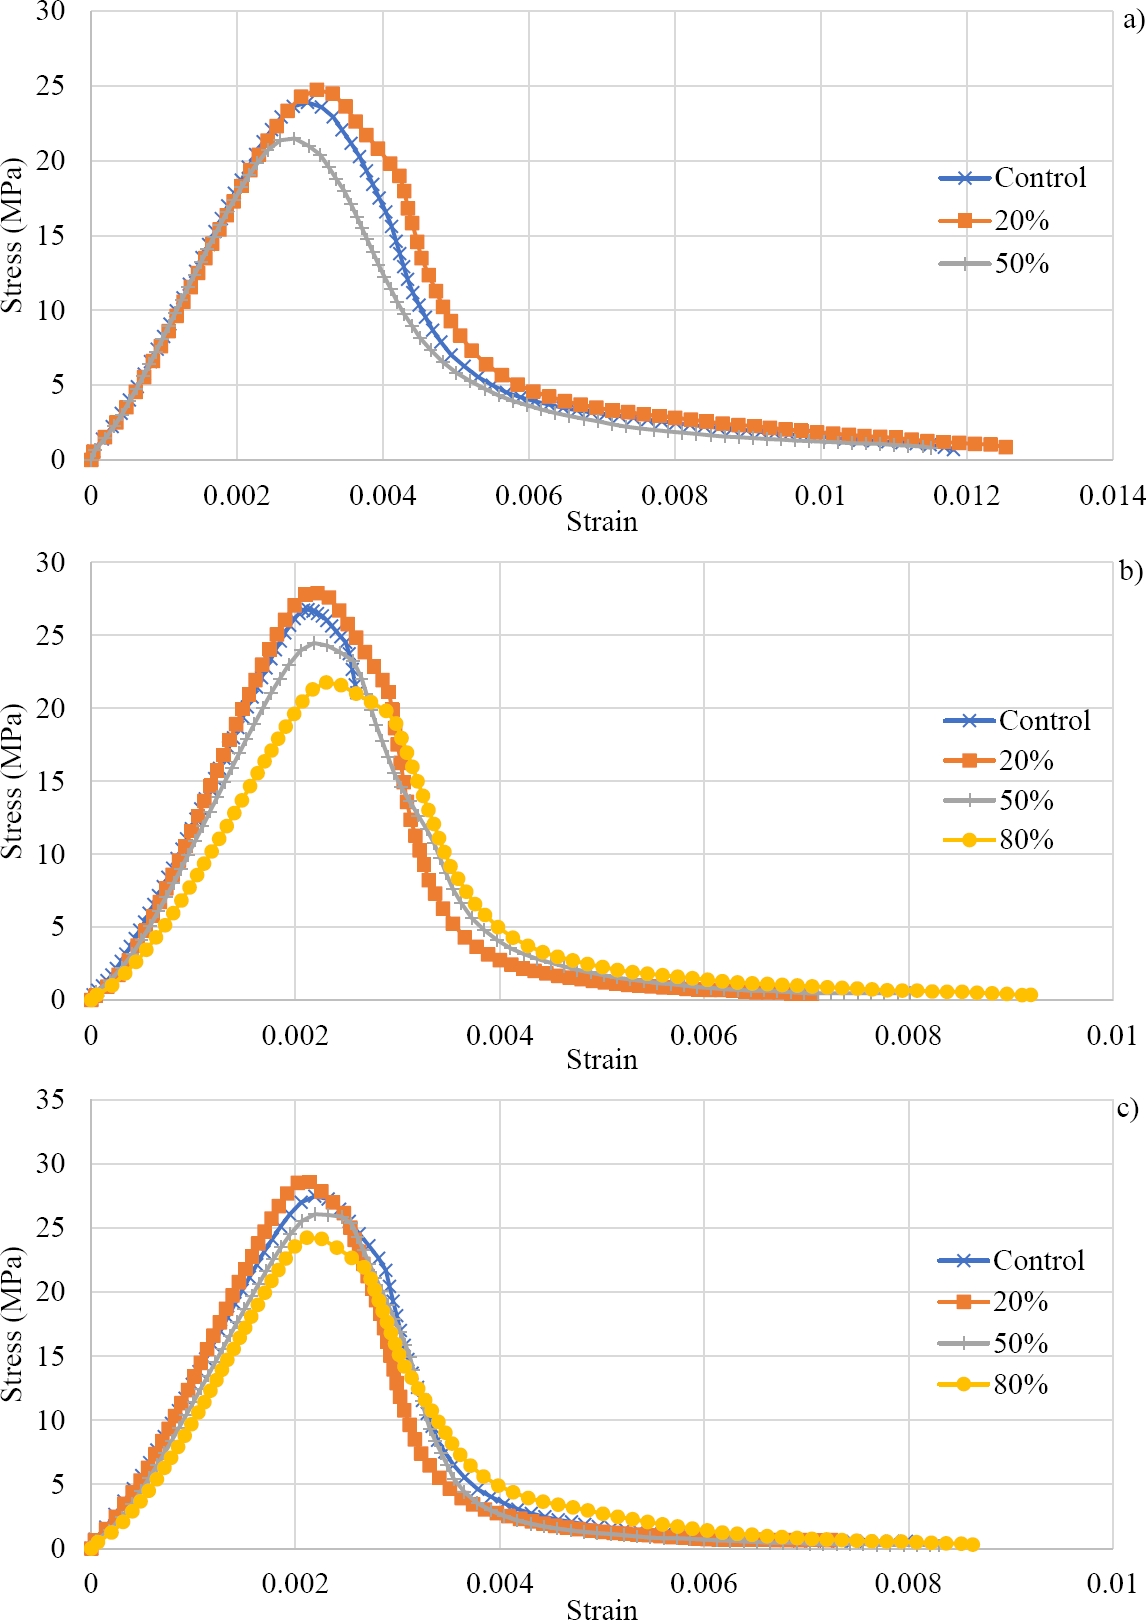
Figure 11. Comparison of the stress-strain graph control vs. stress levels, a) 7 days, b) 28 days, c) 90 days.
Table 1. Percentage of damage corresponding to each stress level and age, associated with capacity and modulus of elasticity.
| Age (days) | Stress level | Compressive strength (MPa) | % Strength damage | Modulus of Elasticity (GPa) | % Elastic modulus damage |
| 7* | Control | 24.00 | - | 24.792 | - |
| Low (20%) | 24.75 | -3.13 | 26.333 | -6.2 | |
| Middle (50%) | 21.58 | 10.08 | 23.956 | 3.4 | |
| 28 | Control | 26.79 | - | 26.821 | - |
| Low (20%) | 27.91 | -4.18 | 27.158 | -1.3 | |
| Middle (50%) | 24.49 | 8.59 | 23.985 | 10.6 | |
| High (80%) | 21.83 | 18.51 | 19.224 | 28.3 | |
| 90 | Control | 27.59 | - | 28.433 | - |
| Low (20%) | 28.71 | -4.06 | 29.211 | -2.7 | |
| Middle (50%) | 26.22 | 4.97 | 24.940 | 12.3 | |
| High (80%) | 24.27 | 12.03 | 22.549 | 20.7 |
*Note: The reported values on compressive strength and the modulus of elasticity at 7 days specimens were extrapolated based on the conducted test and the 28 days estimates (Narayanan, 2021)
The loss (or gain) of stiffness can be defined based on the damage in the material, defined as the level of cracking presented. One form of quantifying this damage is through the strain equivalence hypothesis (Murakami, 2012), expressed in equation (1),
| (1) |
where is the modulus of elasticity of the material evaluated, is the modulus of elasticity of the control specimen, and represents the damage.
Another form of estimating damage is based on the change in the strength previously described, as shown in equation (2),
| (2) |
where is the compressive strength of the material evaluated, corresponds to the strength of the control specimen, and again represents damage. This last equation can be interpreted as a variant of the effective stress formulation (>Liang et al., 2025; >Murakami, 2012).
>Table 1 provides the level of damage caused by the various levels of sustained stress in the specimens tested at various ages under loss of strength and loss of modulus of elasticity and serves as a given time value for the evolution equations in (>Terán-Torres et al., 2024). It is important to mention that the damage shown in >Table 1 is that resulting from initial strain and temporal strain. The damage resulting from initial strain can be easily calculated by subjecting specimens to monotonic loading up to the corresponding stress levels, unloading, and then reloading to failure, and subsequently determining the modulus of elasticity and strength from the test results. The difference between the change in modulus and the reported strengths corresponds to the temporal damage, for equation (1) and equation (2), respectively.
It is important to mention that, for specimens loaded to 20% of their capacity in compression, there is a gain in stiffness and, therefore, the specimen exhibited a negative damage variable. This phenomenon is known in continuum damage mechanics as “healing” and was introduced in (>Abu Al Rub and Darabi, 2012). The above was observed in (>Shah and Chandra, 1970), where it was considered that the distance between two particles decreases, causing an increase in the bond strength between them. While, for medium and high stress cases, the damage is positive, which agrees with (>Iravani and MacGregor, 1998; >Mazzotti and Savoia, 2002). It is important to note that the damage related to compressive strength is inversely proportional to age, i.e., the older the age, the lower the damage under the same level of sustained load, as shown in >Table 1. This is consistent with that observed for strain. However, the opposite occurs with the damage associated with the modulus of elasticity, where the older the age the damage appears to increase.
3.4 Temporal Poisson's ratio
Finally, the Poisson's ratio for creep will be analyzed. Some authors concluded that Poisson's ratio depends on the stress level: for low and medium stresses, the value is constant, while for high stress levels there is an increase, this phenomenon is strictly related to the growth of macro cracks and precedes the failure of the concrete due to tertiary creep (>Mazzotti and Savoia, 2002). In >Figure 12 it can be observed that the Poisson's ratio effectively depends on the level of applied stresses. For example, for the low stress level, Poisson's ratio tends to a value of approximately 0.25. While, for medium levels, it tends to 0.30. However, it is important to note that there is a slight temporal variation, mostly in the younger specimens. Finally, for high levels, the temporal variation is much more notable, showing values between 0.65 and 0.50, which are consistent with the observations of >Mazzotti and Savoia (2002). These ratios exceed the theoretical limit for Poisson's ratio for isotropic materials, indicating an apparent relationship due to cracking.
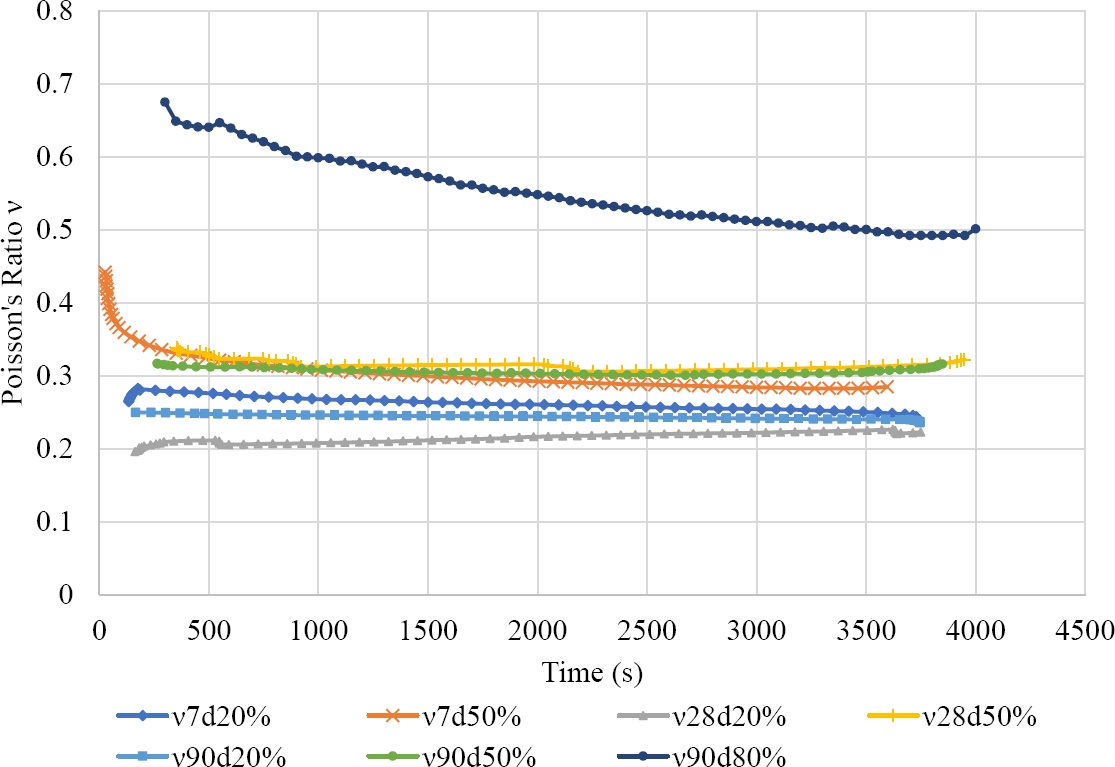
Figure 12. Comparison of Poisson's ratio for various ages and stress level at sustained load.
4. CONCLUSIONS
In the present study, short-term creep tests (approx. 1 hr) were carried out on simple concrete specimens of different ages, i.e., 7, 28 and 90 days, which were subjected to sustained compressive loading under different stress levels, i.e., 20%, 50% and 80% of their compressive strength. The following conclusions were obtained from the tests:
Longitudinal and transverse time-dependent strains were obtained for the various stress states and ages. It was found that as age increases the strains reduce. Likewise, the strain rate increases as the sustained stress state increases. This is consistent with what other authors have reported.
After the creep test, the specimens were tested to failure. It was found that, in specimens subjected to low stress levels, their compressive strength and modulus of elasticity increased. While, for specimens under medium and high sustained stresses, the capacity and modulus of elasticity decayed.
The damage (cracking level) associated with the compressive strength is inversely proportional to the age of the specimen, i.e., the damage for the same stress level is lower as the age increases. However, the opposite was observed for the damage associated with the modulus of elasticity, which increases as age increases.
Finally, Poisson's ratio, determined with the transverse and longitudinal strains, showed that, for low and medium stress levels, it tends to a fixed value. For low sustained stresses, the ratio tends to 0.25. While, for medium stresses, the ratio tends to 0.30. This does not occur for high sustained stresses, where it showed a temporal variation, which is in the range of 0.50 to 0.65.
5. ACKNOWLEDGMENTS
Thanks are given to the Universidad Autónoma de Nuevo León, for the financial support provided to acquire the supplies used in this research through PAICYT 2018, under project IT634-18. Also, thanks are expressed to the authorities of the Facultad de Ingeniería Civil, especially Dr. Pedro Valdez, for providing the scholarship for the graduate student who performed the experiments. Finally, thanks to the authorities of the Instituto de Ingeniería Civil “Dr. Raymundo Rivera Villarreal” of the UANL, for their support for the use of the infrastructure necessary to carry out the experimental tests.
6. REFERENCES
Abu Al-Rub, R. K., Darabi, M. K. (2012). A thermodynamic framework for constitutive modeling of time- and rate-dependent materials. Part I: Theory. International Journal of Plasticity. 34:61–92. https://doi.org/10.1016/j.ijplas.2012.01.002
ACI Committee 211. (2022). Selecting Proportions for Normal-Density and High-Density Concrete – Guide (ACI PRC-211.1-22). American Concrete Institute, Farmington Hills, MI.
Acker, P., Bažant, Z. P., Chern, J. C., Huet, C., Wittmann, F. H. (1998). Measurement of time-dependent strains of concrete. Materials and Structures. 31(212):507–512. https://doi.org/10.1007/BF02481530
ASTM International. (2018). Standard Specification for Concrete Aggregates (ASTM C33). ASTM International, West Conshohocken, PA.
ASTM International. (2020). Standard Test Method for Slump of Hydraulic-Cement Concrete (ASTM C143). ASTM International, West Conshohocken, PA.
ASTM International. (2021). Standard Test Method for Compressive Strength of Cylindrical Concrete Specimens (ASTM C39). ASTM International, West Conshohocken, PA.
ASTM International. (2024). Standard Practice for Making and Curing Concrete Test Specimens in the Laboratory (ASTM C192). ASTM International, West Conshohocken, PA.
ASTM International. (2009). Standard Practice for Capping Cylindrical Concrete Specimens (ASTM C617-09). ASTM International, West Conshohocken, PA.
ASTM International. (2002). Standard Test Method for Creep of Concrete in Compression (ASTM C512-02). ASTM International, West Conshohocken, PA.
ASTM International. (2014). Standard Test Method for Static Modulus of Elasticity and Poisson’s Ratio of Concrete in Compression (ASTM C469-14). ASTM International, West Conshohocken, PA.
Bažant, Z. P., Prasannan, S. (1989). Solidification Theory for Concrete Creep. II: Verification and Application. Journal of Engineering Mechanics, 115(8):1704–1725. https://doi.org/10.1061/(ASCE)0733-9399(1989)115:8(1704)
Bažant, Z. P., Huet, C. (1999). Thermodynamic Functions for Ageing Viscoelasticity: Integral Form Without Internal Variables. International Journal of Solids and Structures, 36(24):3993–4016. https://doi.org/10.1016/S0020-7683(98)00184-X
Bazant, Z. P., Yu, Q., Li, G. H, Klein, G. J., Kristek, V. (2010). Excessive deflections of record-span prestressed box girder. ACI: Concrete International. 32(6):44-52.
Bazant, Z. P., Hubler, M. H., Yu, Q. (2011). Pervasiveness of Excessive Segmental Bridge Deflections: Wake-Up Call for Creep. ACI: Structural Journal. 108(6):766-774. https://doi.org/10.14359/51683375
Bazant, Z. P., Hubler, M. (2014). Theory of cyclic creep of concrete based on Paris law for fatigue growth of subcritical microcracks. Journal of the Mechanics and Physics of Solids, 63:187-200. https://doi.org/10.1016/j.jmps.2013.09.010
Chen, P., Zheng, W., Wang, Y., Du, K., Chang, W. (2019). Strain recovery model for concrete after compressive creep. Construction and Building Materials, 199:746–755. https://doi.org/10.1016/j.conbuildmat.2018.12.021
Collins, T. (1989). Proportioning High-Strength Concrete to Control Creep and Shrinkage. ACI Materials Journal. 86(6):576-580. https://doi.org/10.14359/2211
Iravani, S., MacGregor, J. G. (1998). Sustained Load Strength and Short-Term Strain Behavior of High-Strength Concrete. ACI Materials Journal. 95(5):636–647. https://doi.org/10.14359/406
Liang, W., Wang, S., Lv, X., Li, Y. (2025). Dynamic mechanical properties and damage constitutive model of frozen–thawed basalt fiber-reinforced concrete under wide strain rate range. Materials, 18(14),3337. https://doi.org/10.3390/ma18143337
Linz, P. (1985). Analytical and Numerical Methods for Volterra Equations. Philadelphia: Society for Industrial and Applied Mathematics (SIAM). ISBN: 978-0898711981.
Loo, Y. H. (1992). A new method for microcrack evaluation in concrete under compression. Materials and Structures. 25(10):573-578. https://doi.org/10.1007/BF02472225
Mazzotti, C., Savoia, M. (2001). An isotropic damage model for nonlinear creep behavior of concrete in compression. Fracture Mechanics of Concrete Structures. pp. 255-262.
Mazzotti, C., Savoia, M. (2002). Nonlinear creep, Poisson’s ratio, and creep-damage interaction of concrete in compression. ACI Materials Journal. 99(5): 450–457. https://doi.org/10.14359/12323
Mei, S.-q., Zhang, J.-c., Wang, Y.-f., Zou, R.-f. (2017). Creep-recovery of normal strength and high strength concrete. Construction and Building Materials, 156:175–183. https://doi.org/10.1016/j.conbuildmat.2017.08.163
Murakami, S. (2012). Continuum Damage Mechanics: A Continuum Mechanics Approach to the Analysis of Damage and Fracture. Solid Mechanics and Its Applications, Vol. 185. Dordrecht: Springer.
Murakami, S., Kamiya, K. (1997). Constitutive and damage evolution equations of elastic-brittle materials based on irreversible thermodynamics. International Journal of Mechanical Sciences, 39(4): 473–486. https://doi.org/10.1016/S0020-7403(96)00044-5
Narayanan, S. (2021). Elastic Modulus of Concrete. CE & CR. July:1-7.
Neville, A. M. (2011). “Properties of Concrete”. Pearson Education Limited, Cap 9.
Ouzandja, D. J., Talhaoui, A., Belmekki, M., Bachari, H. (2023). 3D numerical simulation of seismic failure of a concrete gravity dam considering base sliding. Modelling in Civil and Environmental Engineering, 17(2), 43–53. https://doi.org/10.2478/mmce-2022-0010
Pan, Z., Cao, D., Zeng, B., Wang, Y. (2022). Nonlinear Creep Amplification Factor Considering Damage Evolution of Concrete under Compression. Materials, 15(19). https://doi.org/10.3390/ma15196742
Rossi, P., Tailhan, J.-L., Le Maou, F., Gaillet, L., Martin, E. (2012). Basic creep behavior of concretes: Investigation of the physical mechanisms by using acoustic emission. Cement and Concrete Research. 42(1):61–73. https://doi.org/10.1016/j.cemconres.2011.07.011
Shah, S. P., Chandra, S. (1970). Fracture of Concrete Subjected to Cyclic and Sustained Loading. Journal Proceedings of the American Concrete Institute. 67(10):816–827. https://doi.org/10.14359/7312
Su, L., Wang, Y.-f., Mei, S.-q., Li, P.-f. (2017). Experimental investigation on the fundamental behavior of concrete creep. Construction and Building Materials, 152:250–258. https://doi.org/10.1016/j.conbuildmat.2017.06.162
Tamtsia, B. T., Beaudoin, J. J. (2000). Basic creep of hardened cement paste: A re-examination of the role of water. Cement and Concrete Research. 30(9): 1465–1475. https://doi.org/10.1016/S0008-8846(00)00279-9
Tang, C., Zheng, W., Wang, Y. (2020). Creep Failure of Concrete under High Stress. Journal of Testing and Evaluation, 48(5): 3410–3416. https://doi.org/10.1520/JTE20170554
Terán-Torres, B. T., Mohammadi, J., Nair, S. E., Mendoza-Rangel, J. M., Flores-Vivian, I., Juárez-Alvarado, C. A. (2024), Non-Linear Creep-Relaxation Constitutive Damage Model for Aging Concrete. Applied Science. 14(10):1-28. https://doi.org/10.3390/app14104270
Vandewalle, L. (2000). Concrete creep and shrinkage at cyclic ambient conditions. Cement & Concrete Composites. 22(3): 201-208. https://doi.org/10.1016/S0958-9465(00)00004-4
Zhaoxia, L. (1994). Effective Creep Poisson's Ratio for Damaged Concrete. International Journal of Fracture, 66(2):189–196. https://doi.org/10.1007/BF00020083
Zhong, K., Deierlein, G. G. (2019). Low‑cycle fatigue effects on the seismic performance of concrete frame and wall systems with high strength reinforcing steel. CRC, Pankow Foundation / ACI Foundation. https://doi.org/10.1016/51734214
Zhou, M., Chen, Y. (2024). Fatigue assessment of reinforced concrete bridge decks under realistic traffic loading using a hybrid model. Advances in Bridge Engineering, 5(1), 12. https://doi.org/10.1186/s43251-023-00112-2