
| Basic Research | https://doi.org/10.21041/ra.v15i3.826 |
Virtual drift ratio rehabilitation by composite and contact beams of a reinforced concrete building based on mixed testing
Rehabilitación distorsional virtual mediante trabes compuestas y de contacto de un edificio de concreto reforzado basado en pruebas mixtas
Adaptação virtual à distorção por vigas mistas e de contacto de um edifício de betão armado com base em ensaios mistos
C. A. Torres Montes de Oca1* M. A. Segovia Huitrón2R. Prado González3A. G. Alba Campos4
1 Profesor investigador en la Sección de Estudios de Posgrado e Investigación (SEPI), Escuela Superior de Ingeniería y Arquitectura Unidad Tecamachalco (ESIA UT), Instituto Politécnico Nacional (IPN), 53950, Naucalpan de Juárez, Estado de México, México, http://www.sepi.esiatec.ipn.mx.
2 Egresado de maestría en la Escuela Superior de Ingeniería y Arquitectura Unidad Tecamachalco (ESIA UT), Instituto Politécnico Nacional (IPN), 53950, Naucalpan de Juárez, Estado de México, México, http://www.esiatec.ipn.mx.
3 Alumno de nivel maestría en la Escuela Superior de Ingeniería y Arquitectura Unidad Tecamachalco (ESIA UT), Instituto Politécnico Nacional (IPN), 53950, Naucalpan de Juárez, Estado de México, México, http://www.esiatec.ipn.mx.
4 Alumno de nivel licenciatura en la Escuela Superior de Ingeniería y Arquitectura Unidad Tecamachalco (ESIA UT), Instituto Politécnico Nacional (IPN), 53950, Naucalpan de Juárez, Estado de México, México, http://www.esiatec.ipn.mx.
*Contact author: ktcate2@hotmail.com; ctorresmo@ipn.mx
Received: 15/05/2025
Revised: 29/06/2025
Accepted: 15/08/2025
Published: 01/09/2025
| Cite as: Torres Montes de Oca, C. A. Segovia Huitrón, M. A., Prado González, R., Alba Campos, A. G. (2025), “Virtual drift ratio rehabilitation by composite and contact beams of a reinforced concrete building based on mixed testing”, Revista ALCONPAT, 15 (3), pp. 348 – 383, DOI: https://doi.org/10.21041/ra.v15i3.826 |
Abstract
The objective of this research is to simulate, by means of virtual modeling, the recovery of the drift ratio stability of a reinforced concrete building by means of composite and contact beams. The methodological procedure is based on previous studies such as pathological auscultation, concrete coring, sclerometry, environmental vibration tests, soil mechanics and generation of mathematical models. The analyses and studies are carried out in accordance with national and international standards. The model representing the current state of the structure was numerically calibrated. The results indicate that by using composite section beams for the reinforcement of the system, greater stiffness is obtained in the superstructure compared to contact beams.
Keywords: drift ratio rehabilitation; composite beams; contact beams; structural modeling; mixed testing.
NOMENCLATURE
| Area of the i-th section that make up the clad column. | |
| Az | Roof |
| BD | Denison barrel |
| Cen | Center |
| CL | Free field |
| Cmax | Maximum load |
| CRCE | With springs in foundation with contact between buildings |
| CRSE | With springs in foundation without contact between buildings |
| CRTC | With springs in foundation with contact beams |
| CRTCM | With springs in foundation with composite beams |
| δ | Deflections, deformations, or lateral displacements |
| δv | Vertical deflections or deformations |
| δx | Lateral displacement in the X direction |
| δy | Lateral displacement in the Y direction |
| EA | Current state |
| Ec | Modulus of elasticity of concrete |
| Ece | Theoretical elastic modulus related to sclerometric tests |
| Ecl | Existing elastic modulus obtained from laboratory tests |
| Ecn | Theoretical modulus of elasticity for new concrete |
| Ecp | Weighted modulus of elasticity |
| EᴧF | Signal amplitude in a specific frequency interval |
| Ei | i-th elastic modulus of the section that makes up the clad column |
| EL | Elongation |
| ER | Response spectrum |
| EsPot | Power spectrum |
| ESQ | Corner |
| ESQNE | Northeast corner |
| ESQNW | Northwest corner |
| ESQSE | Southeast corner |
| ESQSW | Southwest corner |
| FAS | Transfer functions |
| f’c | Axial compressive strength of concrete with laboratory tests |
| f’c es | Compressive strength obtained with sclerometric tests |
| fe | Vibration frequency of the structure |
| fy | Elastic limit of steel |
| γ | Interstory drift or drift ratio |
| γL | Limit drift ratio |
| γ x | Interstory drift in the X direction |
| γ y | Interstory drift in the Y direction |
| Hz | Hertz |
| H/V | Horizontal to vertical spectral ratio |
| i | i-th |
| ISE | Soil-structure interaction |
| kx | Contact spring in the X direction |
| ky | Contact spring in the Y direction |
| kh | Horizontal spring in foundation |
| kv | Vertical spring in foundation |
| L | Slab |
| L(x) | Longitudinal in the X direction |
| M | Structure vibration mode |
| n | Number of sections comprising the clad column |
| N | Floor level |
| NE | Northeast |
| P | Location of ambient vibration testing |
| PB | Ground floor |
| PCA | Open pit |
| Q | Ductility factor |
| Rot(x) | Rotation in X direction |
| Rot(y) | Rotation in Y direction |
| Maximum stress | |
| SM | Mixed sounding |
| SPT | Standard Penetration Test |
| SRCE | No springs in foundation with contact between buildings |
| SRSE | No springs in foundation without contact between buildings |
| SRTC | No springs in foundation with contact beams |
| SRTCM | No springs in foundation with composite beams |
| SW | Southwest |
| T | Beam |
| Tp | Main beam |
| T(s) | Structure vibration period in seconds |
| Ts | Secondary beam |
| T(y) | Transverse in Y direction |
| VA | Ambient vibration |
1. INTRODUCTION
It has been observed that reinforced concrete structures tend to deteriorate and crack over time, leading to a loss of rigidity, and their useful life is around 50 years (NTC-Concrete, 2023). However, in real conditions, this is not always the case, given the degradation of the structure resulting from construction errors due to supervision limitations, few design specifications, and poor maintenance, including the incidence of recurrent earthquakes. Currently, there are many reinforced concrete buildings that are reaching the end of their useful life and have withstood accidental stresses such as seismic events and differential settlement, among others, which have contributed to accelerating their deterioration. For this purpose, in reinforced concrete buildings that have deteriorated significantly, it is common to resort to structural reinforcement as a corrective measure. However, to carry out an adequate reinforcement design, it is necessary to consider restoring a certain degree of rigidity, which is crucial for keeping the structure's displacements and distortions within permissible ranges (Figure 1).
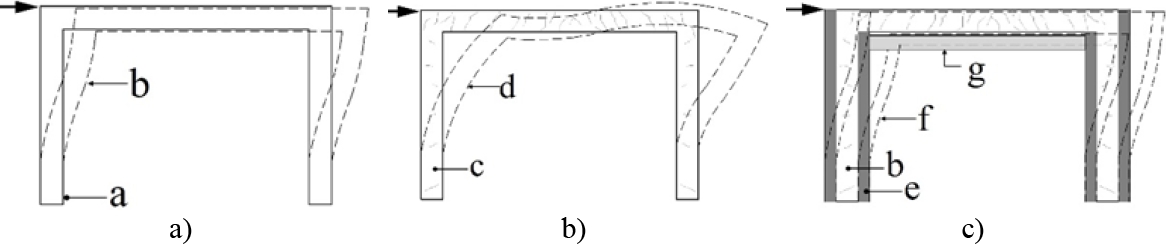
Figure 1. Behavior of reinforced concrete buildings based on frames with and without rigid diaphragms: a) building in normal conditions with rigid diaphragm; b) cracked building with loss of rigid diaphragm; c) rehabilitated building with diaphragm recovery. Where: a = undeformed structure, b = displacement of structure where rigid diaphragm is maintained, c = cracked structure, d = deformation of cracked structure, e = reinforcement of cracked column, f = displacement of reinforced structure, g = reinforcement with steel beam. Note: theory taken from Chopra, A. (2014), image modified by the authors.
According to Figure 1, concrete buildings that are damaged or do not comply with local structural safety regulations must be inspected and, if necessary, reinforced. Mexico is a highly seismic country with many buildings constructed with these types of materials and construction systems that are vulnerable to the effects of this phenomenon. The selection of the type of reinforcement depends on the construction system, structural damage, architectural functionality, and soil characteristics. Because of this, it is essential to understand the actual physical condition of the building to be reinforced, which is why it is essential to study its physical and mechanical properties. Although there is currently a wide variety of mathematical, graphical, and computational tools available, it is necessary to analyze the structural behavior of each building individually, since, even though the construction systems are similar and based on frames formed by columns and beams, each one must be located in a unique behavior compatible with the site where it is planted, including adjacent structural bodies. This document presents the structural analysis of a real case in a state of deterioration, built with reinforced concrete columns and beams.
In order to facilitate general understanding and show the sequence of studies and proposals for reinforcements to rehabilitate lateral displacement and drift ratio, Figure 2 shows the relevant flow chart. This diagram is read from top to bottom following the direction of the solid arrows, where the dotted arrow represents a possible restart of the process when the results of the virtual analyses are unfavorable.
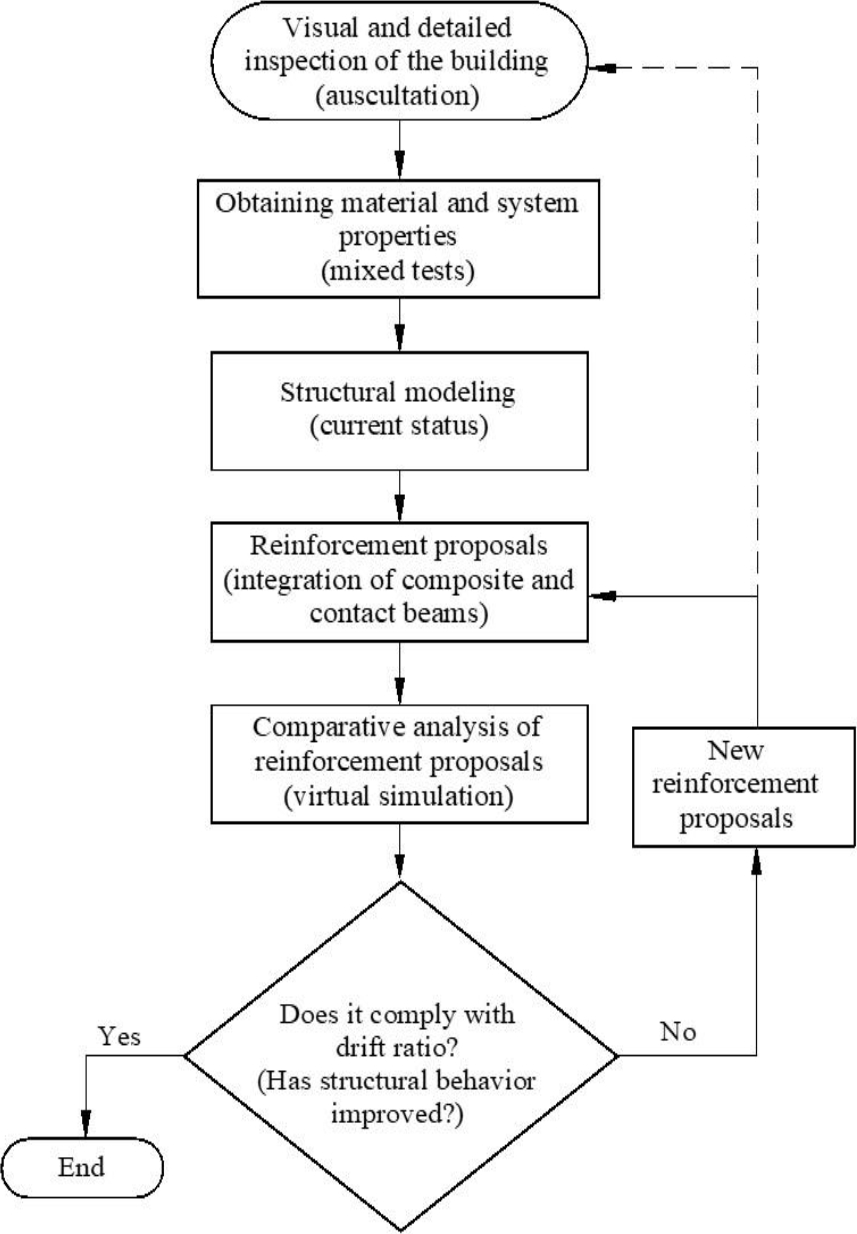
Figure 2. Flowchart of the study phases and reinforcement proposals for the rehabilitation of lateral displacement and drift ratio.
2. DETAILED INSPECTION
The building is currently in disuse due to its level of structural deterioration, which includes cracks in the main and secondary beams, as well as widespread deterioration throughout much of the building due to lack of maintenance (Figure 3).
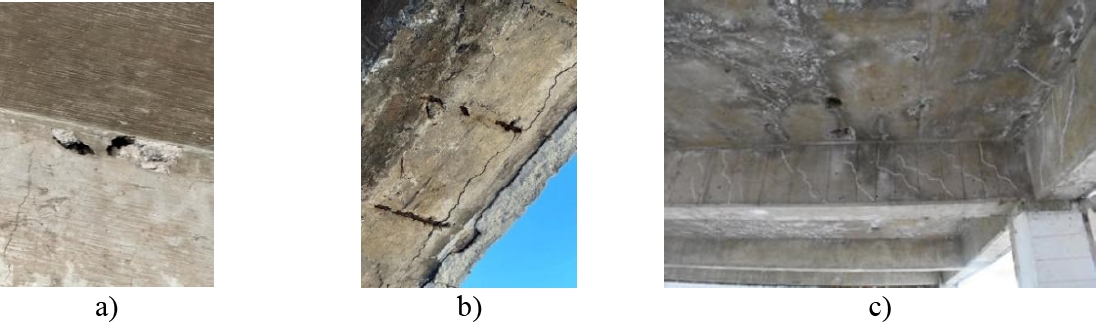
Figure 3. Damage and deterioration in the building; a) cracks and cavities in existing beams; b) corrosion in exposed reinforcing steel in secondary edge elements that do not provide lateral rigidity; c) presence of saltpeter and moisture in concrete slabs.
To obtain detailed information about the current physical structure, minimally invasive and non-invasive tests were carried out (Figure 5) to determine the compressive strength f'c (red dots) and the modulus of elasticity Ec (black dots) in accordance with the provisions of NTC- Structural Rehabilitation 2023. For the minimally invasive tests, concrete cores were extracted in accordance with the provisions of Mexican Standard (NMX-C-169-ONNCCE-2009). These specimens were prepared and detailed to obtain perpendicularity and flatness at their ends (NMX-C-109-ONNCCE-2013). Subsequently, the test was carried out to determine the f'c under the criteria established in NMX-C-083-ONNCCE-2014. The Ec was determined under the provisions of NMX-C-128-ONNCCE-2013. On the other hand, mechanical tests were performed on test specimens (Figure 4) of reinforcing steel (brown dots), obtaining the elasticity limit (fy) of each sample.
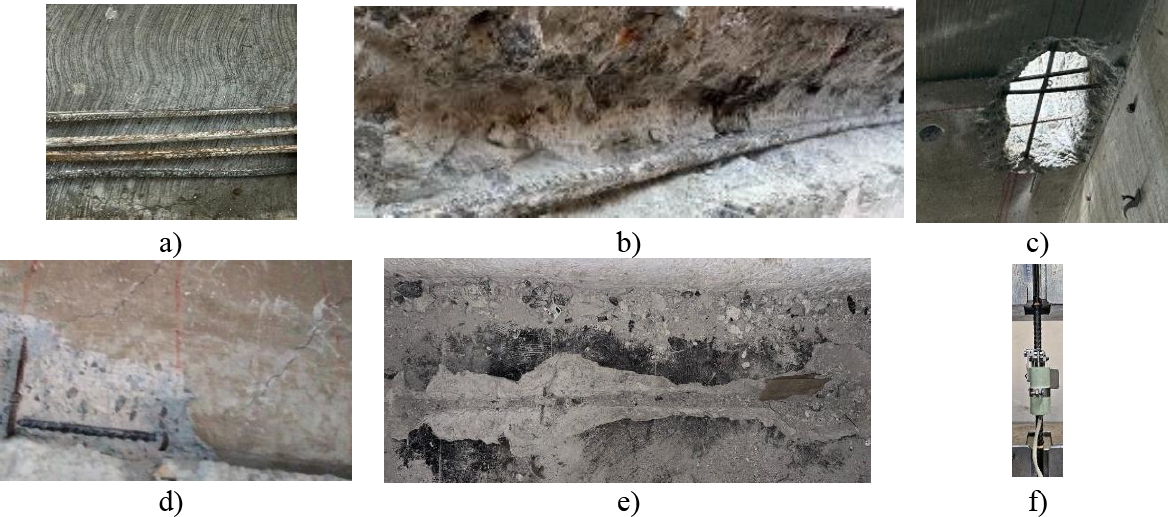
Figure 4. Extraction of reinforcing steel test specimens; a) steel test specimens; b) in secondary beam; c) in lower part of slab; d) in main beam; e) in upper part of slab; f) Tinius LoCap universal testing machine.
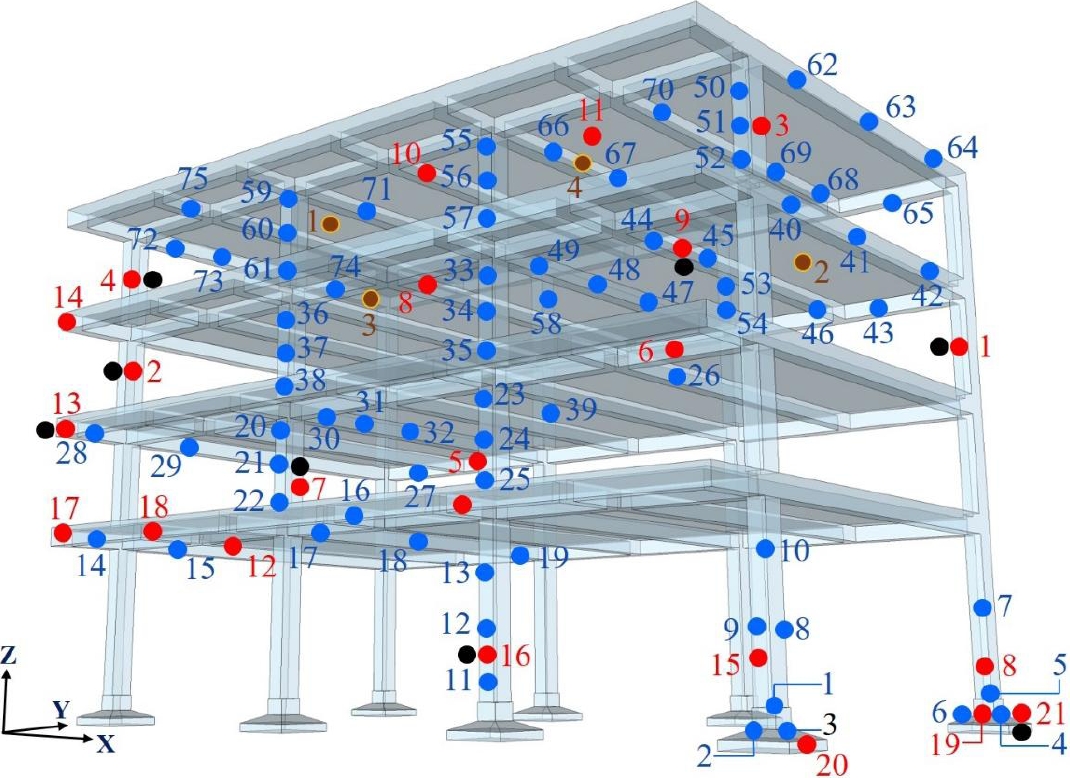
Figure 5. Location of tests in concrete and steel specimens. Where: black dots represent specimen extractions to obtain modulus of elasticity with laboratory tests, red dots indicate specimen extraction sites to obtain axial compressive strength with laboratory tests, blue dots indicate the locations of sclerometer tests to obtain compressive strengths, and cherry dots refer to steel test specimens (Figures 4, 6, and 7).
Extraction of reinforcing steel test specimens; a) steel test specimens; b) in secondary beam; c) in lower part of slab; d) in main beam; e) in upper part of slab; f) Tinius LoCap universal testing machine.
The test method was carried out in accordance with ASTM E-8/E8M-16a through the standard test for tensile testing of metallic materials. It should be noted that during the tests, the stress-strain graphs were not captured; however, it was possible to measure the elongation (EL), maximum stress (σmax), maximum load (Cmax), and yield strength (fy) in test specimens with a length of 20 cm and a diameter of 3/8 inch (Table 1).
Table 1. Mechanical properties of reinforcing steel
| Specimen | Element | Location | EL (%) | Cmax (kg) | σmax (kg/cm²) | fy (kg/cm²) |
| 1 | LN3 | 1-2, A-B | 10 | 3875 | 8770 | 5220 |
| 2 | LN2 | 3-4, A-B | 9.5 | 5375 | 7583 | 5714 |
| 3 | TN2 | 1, A-B | 11 | 5300 | 7477 | 5379 |
| 4 | TN3 | 3, A-B | 10.5 | 5350 | 7522 | 5549 |
Where: L = slab, T = beam, N = floor level. The test specimens (brown dots) are identified in figure 4.
Sclerometry studies were carried out at different points of the building with a rebound hammer in accordance with the criteria established in NMX-C-192-ONNCCE-2018 (Figures 5 and 6) to obtain the f 'c value and supplement and/or compare them with the results obtained from the concrete cores, for which 75 tests were performed with 16 impacts each. The values obtained are shown in Figure 7.
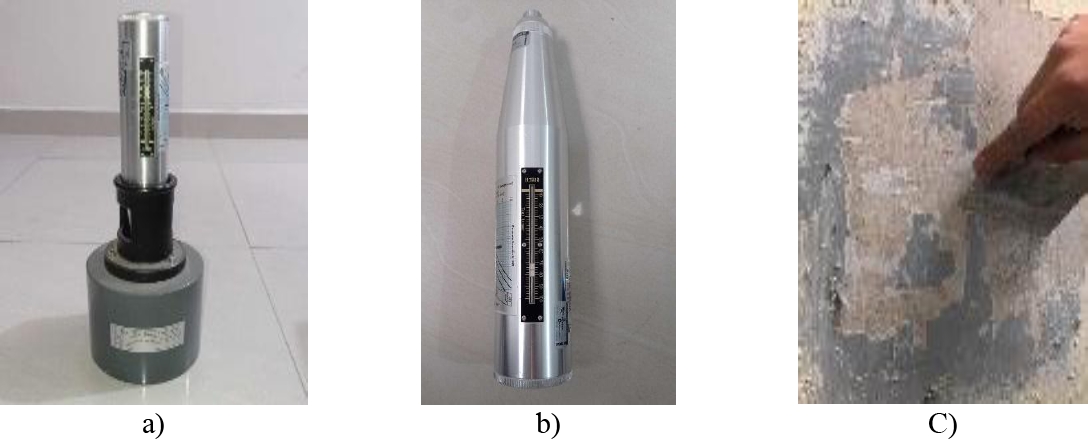
Figure 6. Tool for sclerometer testing; a) calibration of test hammer; b) sclerometer; c) surface cleaning with enamel paint remover.
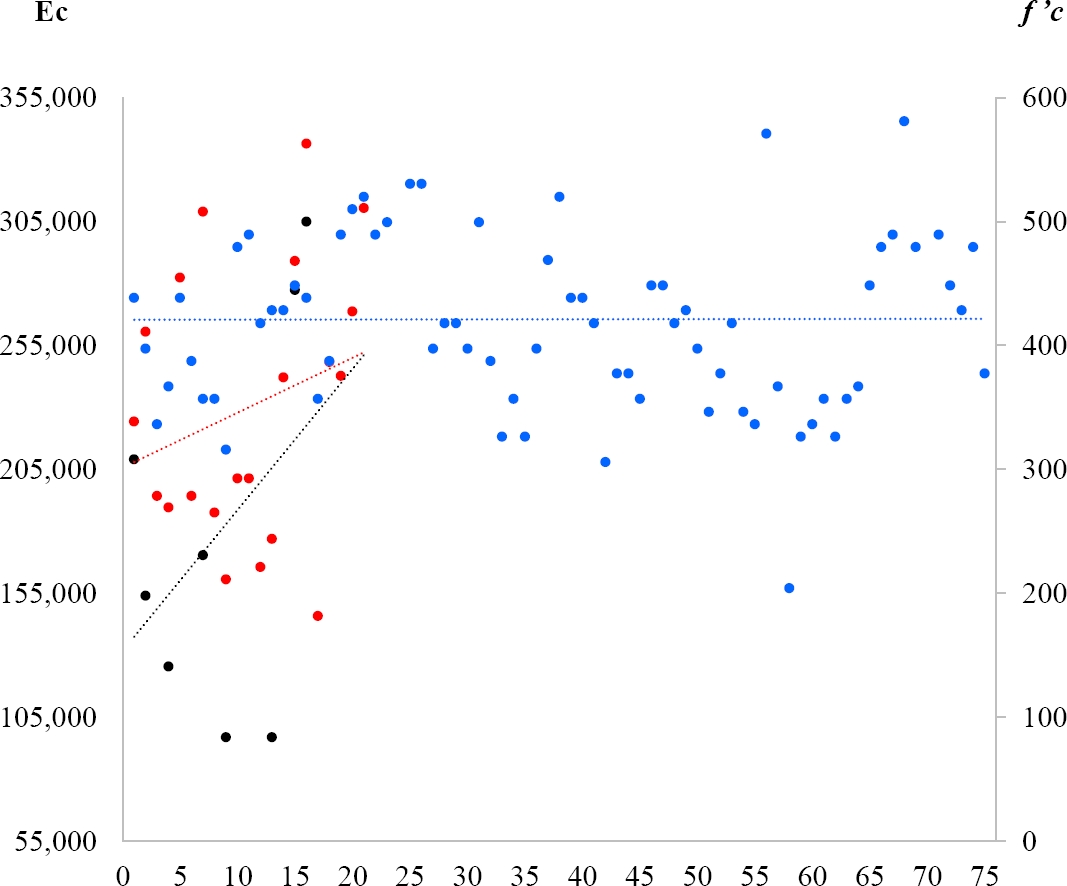
Figure 7. Concrete core and sclerometer tests. Values of f ’c and Ec. Where: Ecl = Modulus of elasticity with laboratory tests (black dots), f’c = Axial compressive strength with laboratory tests (kg/cm², red dots), f ’c es = Compressive strength obtained with sclerometer tests (kg/cm², blue dots).
It should be noted that the areas and locations where the tests were carried out were selected in accordance with the permits granted for access to only certain areas of the building.
Soil mechanics studies were carried out using two mixed probes (SM) and five open pits (PCA), where the SM were performed with standard penetration tests (SPT) and Denison barrels (BD), in accordance with NTC-Cimentación (2023) and ASTM (2018), which allowed for the identification of stratigraphic conditions, soil mechanical characteristics, and seismic response spectrum of the site. The first 15 cm revealed a layer of asphalt pavement, followed by a fill consisting of silty sand with gravel and gravel with a thickness of 175 cm. For this same layer, the number of blows was 7 to 44, obtaining a water content of 12 to 23%, with 23 to 41% sand and 31% gravel. The last layer identified was basalt rock with a thickness of 450 cm (Figure 8).
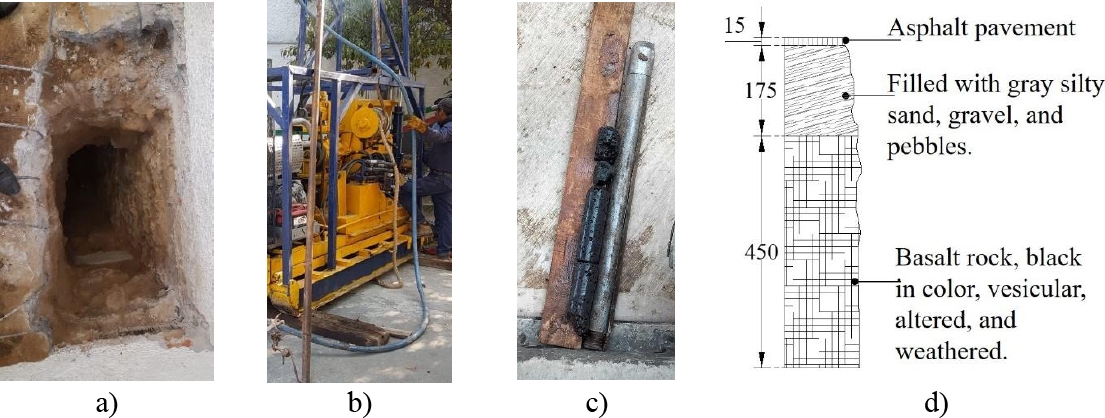
Figure 8. Soil auscultation; a) open pit (PCA); b) standard penetration test (SPT) and Denison barrel (BD); c) extracted samples; d) stratigraphy, measurements in cm.
The slab construction system consists mainly of reinforced concrete and fillers (Figure 9), supported by reinforced concrete beams (Figure 3c).
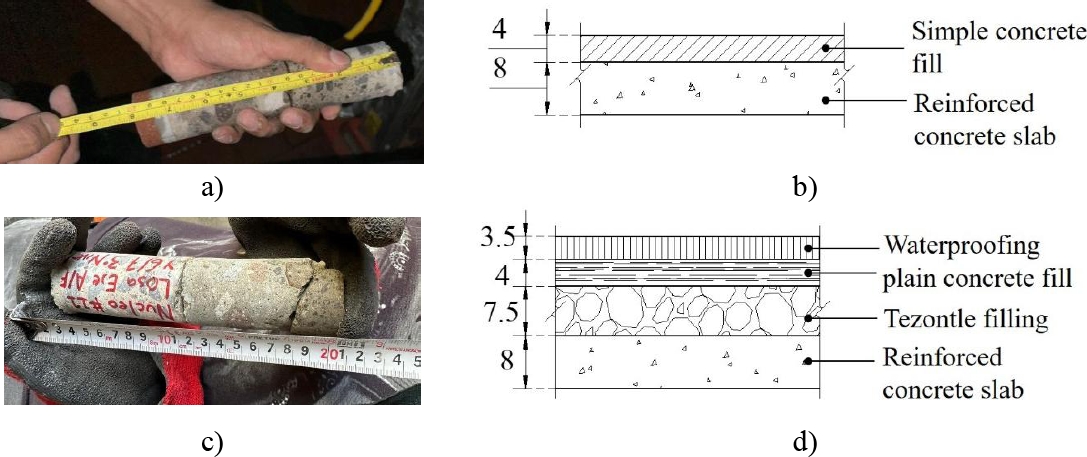
Figure 9. Construction system in floor and roof slabs; a) materials found in floor slab; b) thicknesses of materials in floor slab; c) materials found in roof slab; d) thicknesses of materials in roof slab. Units in cm.
The vertical deflections or deformations (ẟv) of the main and secondary beams of the building are presented in Table 2.
Tabla 2. ẟv en el centro de las trabes de concreto reforzado.
| PB | N1 | N2 | N3 | ||||||||||||||||
| 1 | 2 | 3 | 4 | 5 | 6 | 7 | 8 | 9 | 10 | 11 | 12 | 13 | 14 | 15 | 16 | 17 | 18 | 19 | 20 |
| 2.1 | 1.5 | 1.9 | 3.3 | 2.0 | 1.3 | 1.4 | 1.8 | 2.7 | 1.9 | 3.6 | 4.5 | 4.5 | 4.6 | 3.0 | 3.6 | 4.1 | 3.7 | 3.8 | 4.8 |
Where: PB = Ground floor, L1 = Level 1, L2 = Level 2, L3 = Level 3. ẟv measurements taken at the center of the span. Units in cm.
Figure 10 shows response spectra (ER) and, according to the seismic regionalization indicated in the Manual de Diseño de Obras Civiles de Diseño por Sismo (CFE, 2015), the site spectrum (gray line) is obtained through a real seismic signal at station FJ74 of the Centro de Instrumentación y Registro Sísmico A.C. (CIRES). The station is located 1.2 km from the study site (RSCDMX, 2023) and corresponds to September 19, 2017, with a magnitude of 7. 1 Richter (CENAPRED 2018). However, for the analysis of the cases of reinforcement with composite and contact beams developed in this work, the Roca (CFE) spectrum indicated by the blue line is used, since this is not negligible and the reinforcement in the foundation is proposed at rock level.
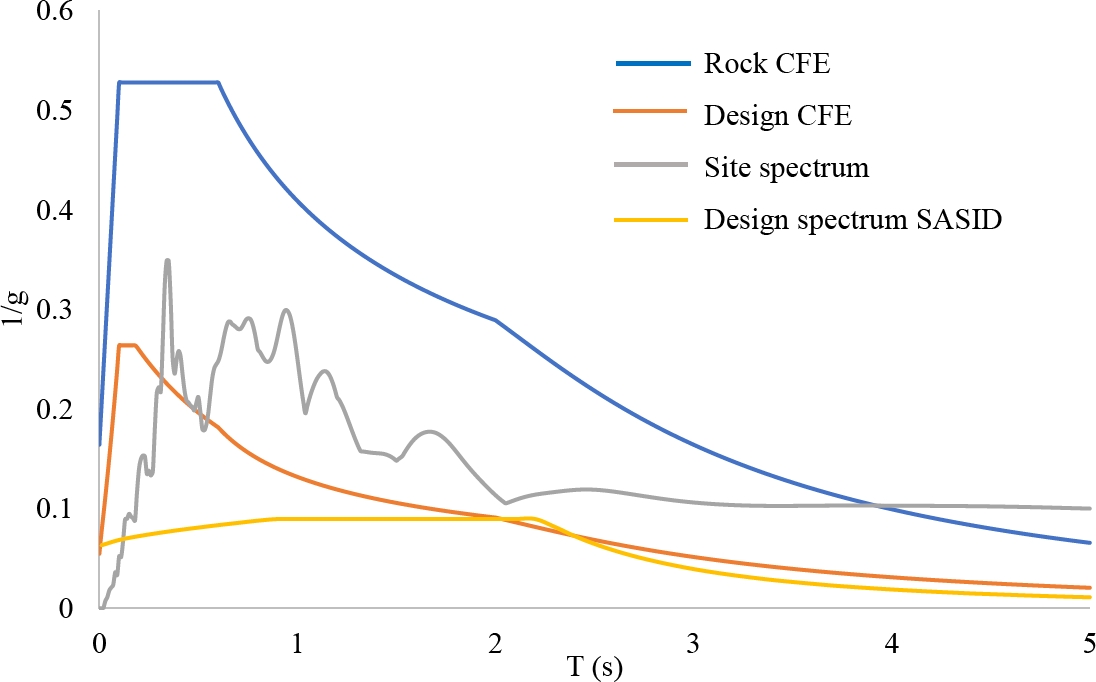
Figure 10. Response spectra Q = 2. Where T(s) = Period in seconds, Q = ductility factor
Figures 11 and 12 show, in general terms, the location of the tests carried out on the structural elements, as well as the sections of existing structural elements.
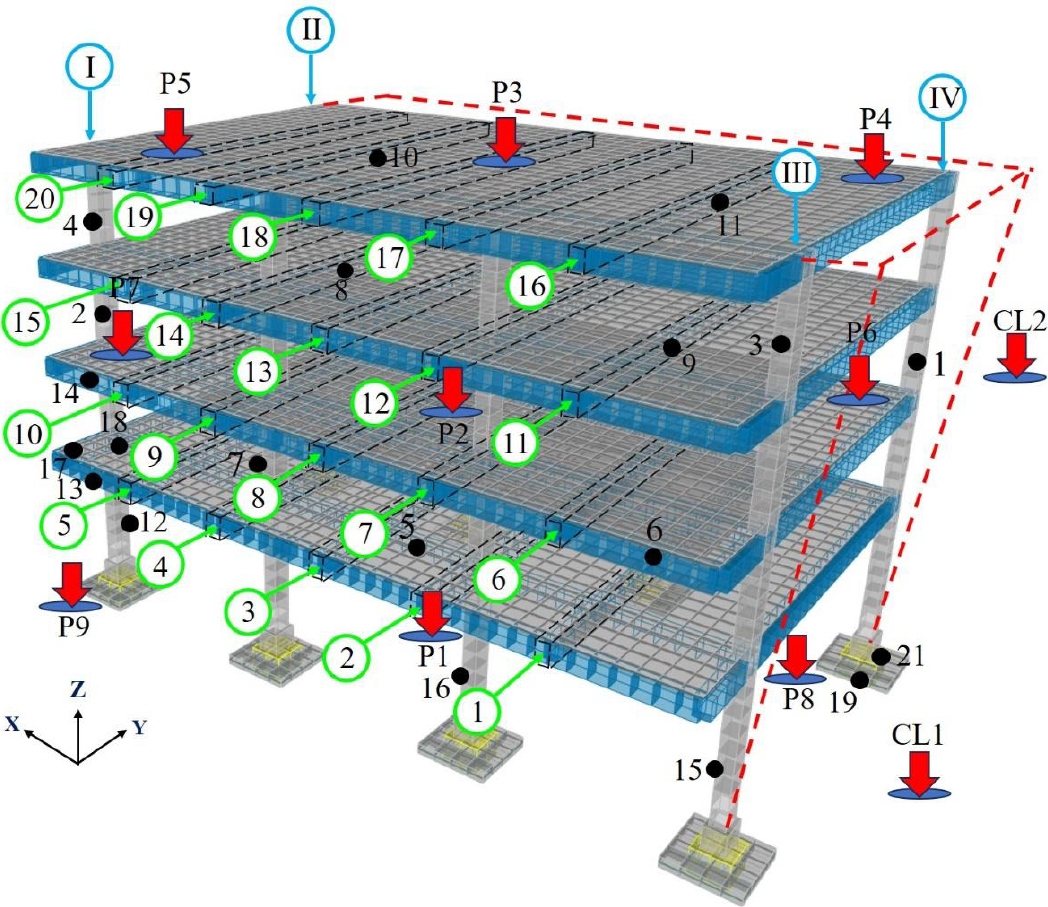
Figure 11. Current state (EA); location of deformations in concrete beams, loss of verticality, identification of extracted concrete cores, and ambiental vibration measurement points. Where: CL represents the free field, black dots indicate concrete cores extracted to obtain Ec, green circles indicate beams with deformation, red arrows indicate the locations where accelerometers were placed, and blue circles with Roman numerals indicate the reference axes for measuring loss of verticality.

Figure 12. Structural concrete elements of the EA; a) Columns (C1); b) Main beams (Tp); c) Secondary beams (Ts). Dimensions in cm.
3. DYNAMIC MONITORING
Ambiental vibration (VA) data was collected at nine points located as shown in Figure 13, where accelerometers were placed starting at the roof level, with these points repeated on the lower levels.
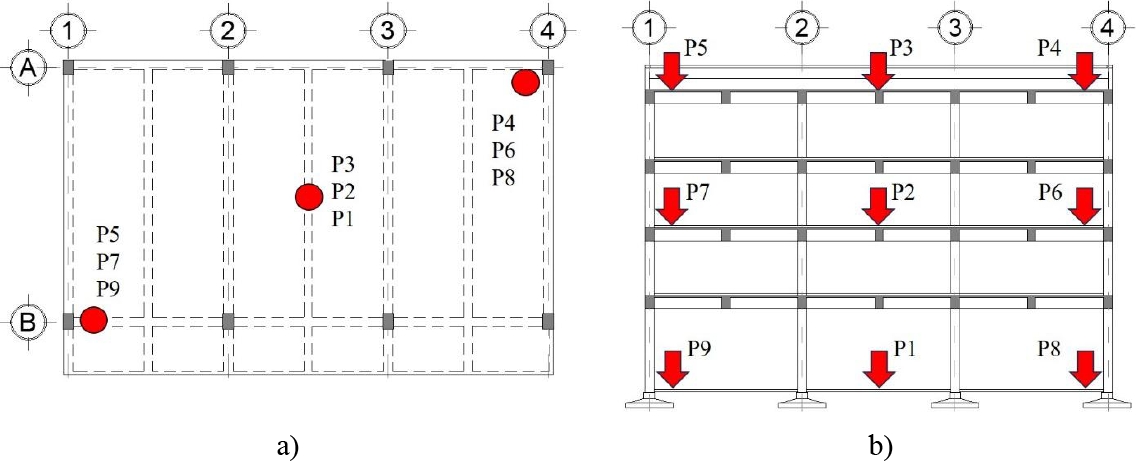
Figure 13. VA measurement points; a) location of measurement points in the standard floor plan; b) location of points in the general section. Where: P1 = PB Cen, P2 = N2 Cen, P3 = Az Cen, P4 = Az ESQNW, P5 = Az ESQSE, P6 = N2 ESQNW, P7 = N2 ESQSE, P8 = PB ESQNW, P9 = PB ESQSE.
In order to calibrate the mathematical model with the actual building, the properties and dynamic characteristics of the system were determined using non-parametric techniques based on the analysis of signals in the time and frequency domains (Figures 14 to 23) (Muriá, 2007; Camargo, 2012 and 2013; Torres, 2009).
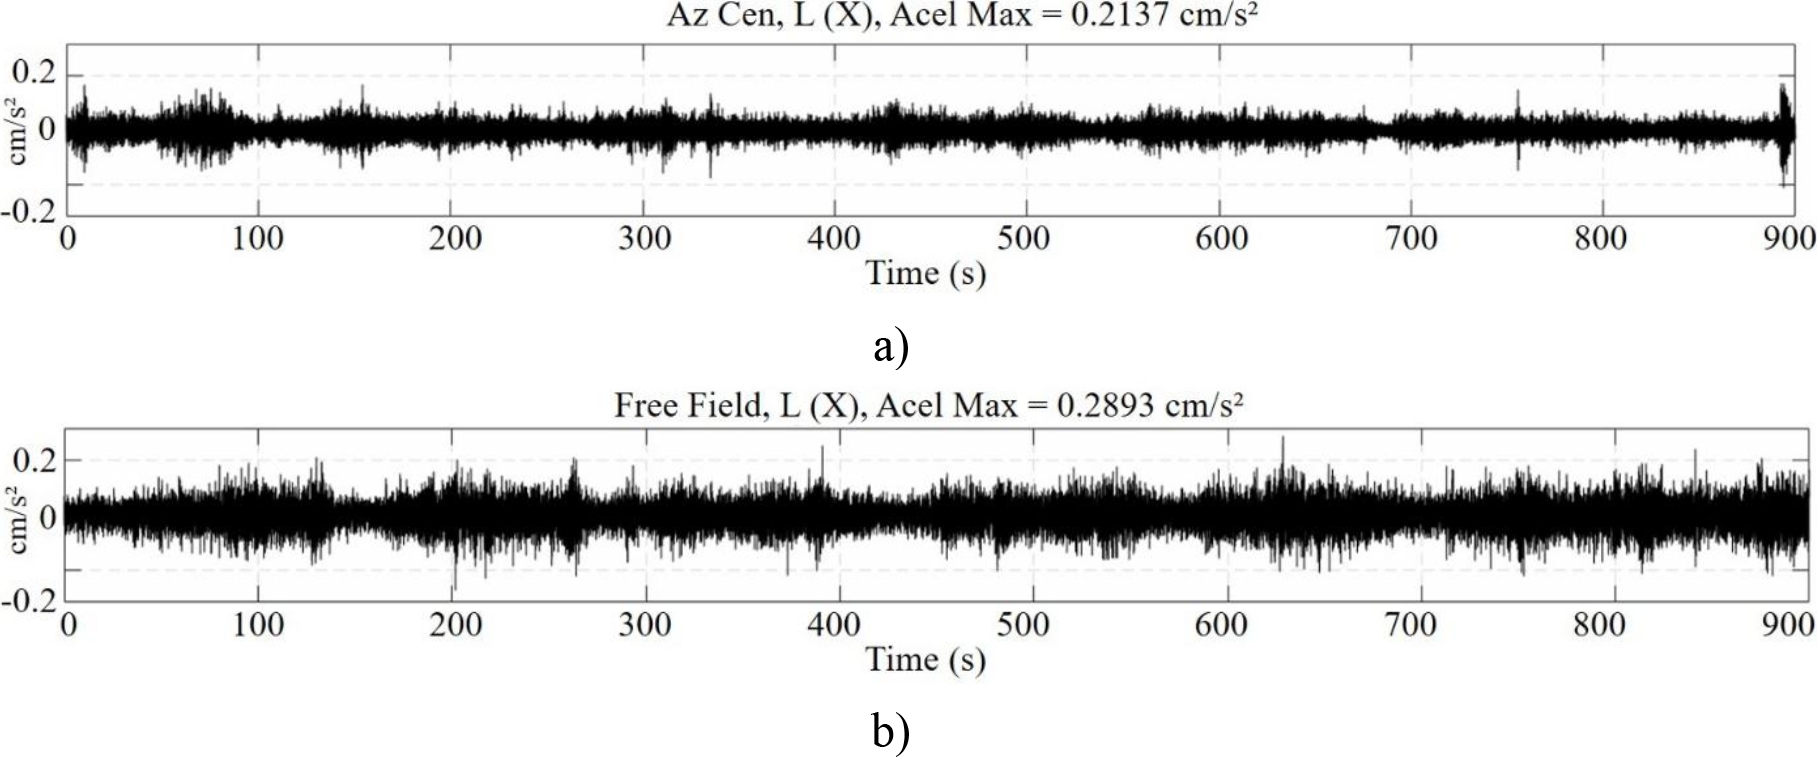
Figure 14. Ambiental vibration (VA) signals located at the geometric center of the roof (Az Cen) L(X) and free field (CL) L(X); a) Az Cen L(X); b) CL. Where L=longitudinal, Az = roof.
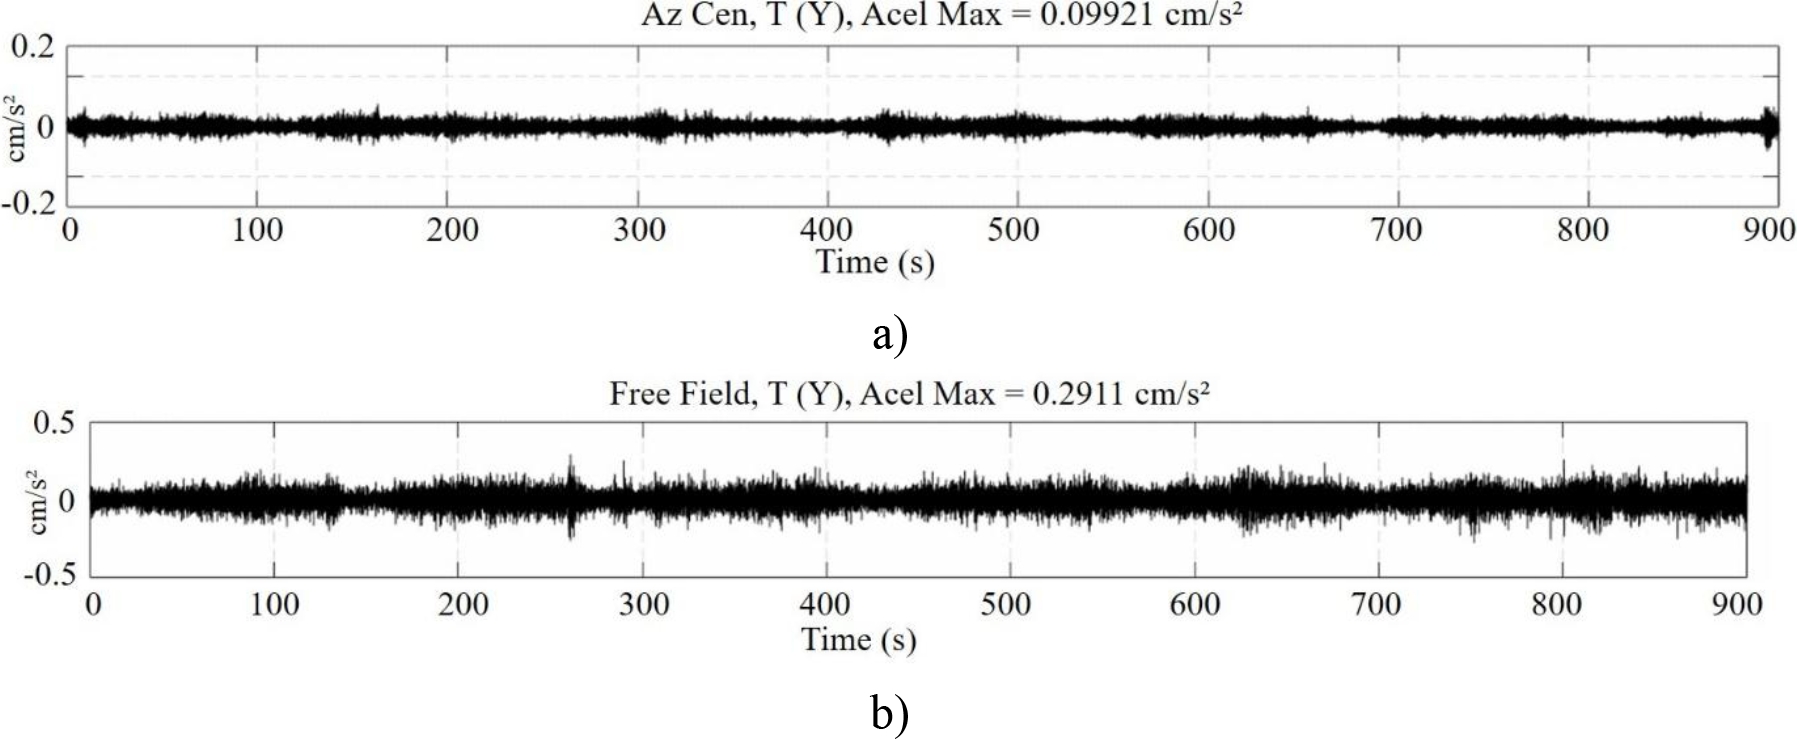
Figure 15. VA signals located at the geometric center of the roof (Az Cen) T(Y) and free field (CL) T(Y); a) Az Cen T(Y); b) CL. Where T = Transversal.
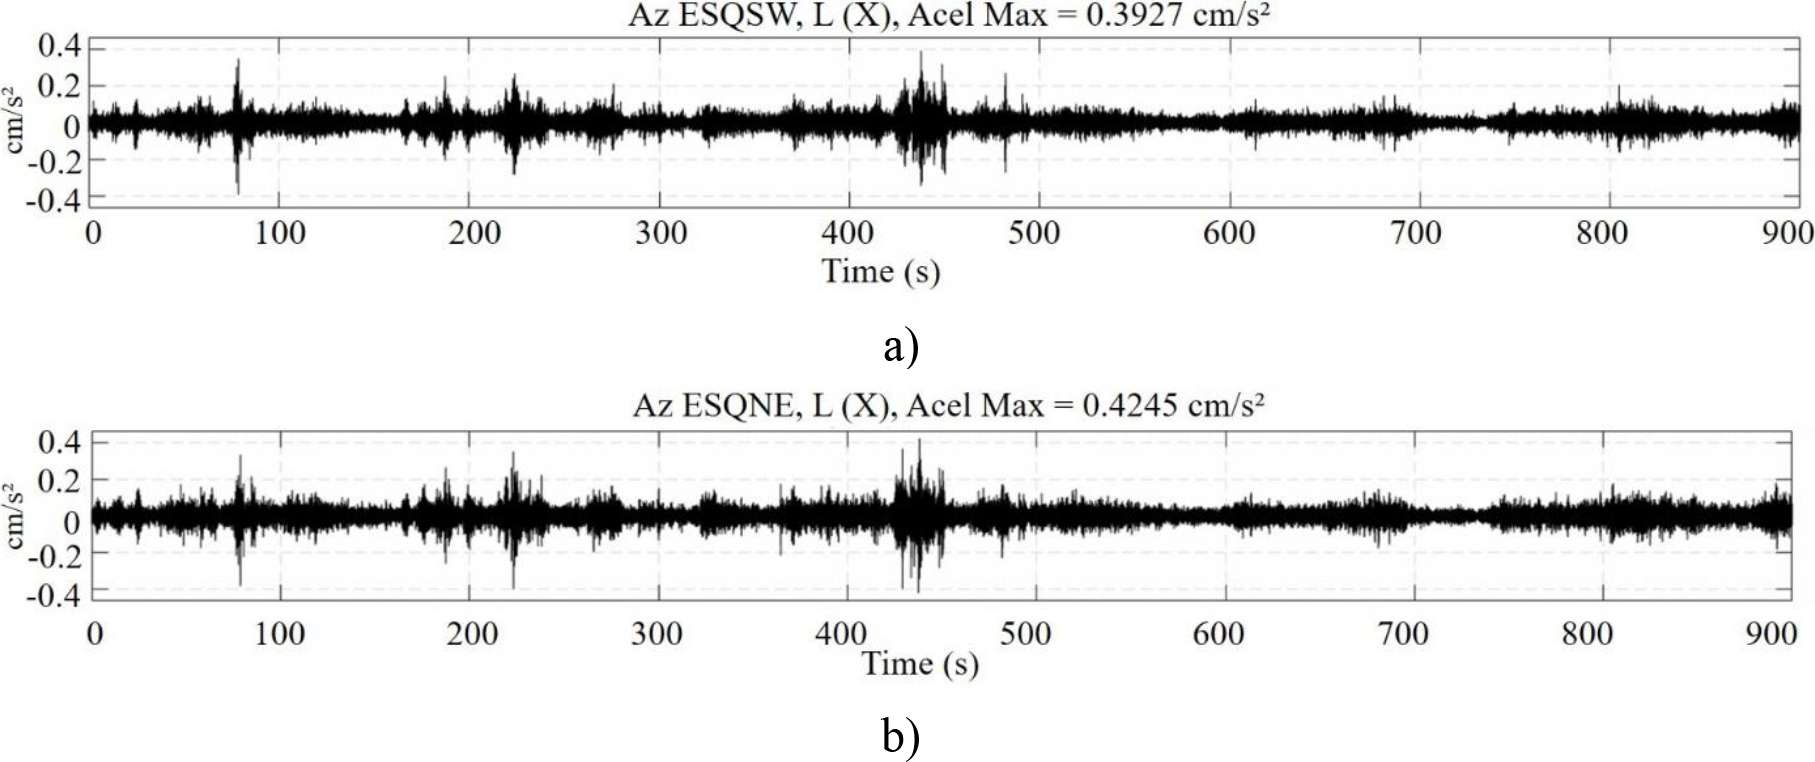
Figure 16. VA signals located to the southwest (SW) and northeast (NE); a) Az ESQSW L(X); b) Az ESQNE L(X). Where ESQ = corner.
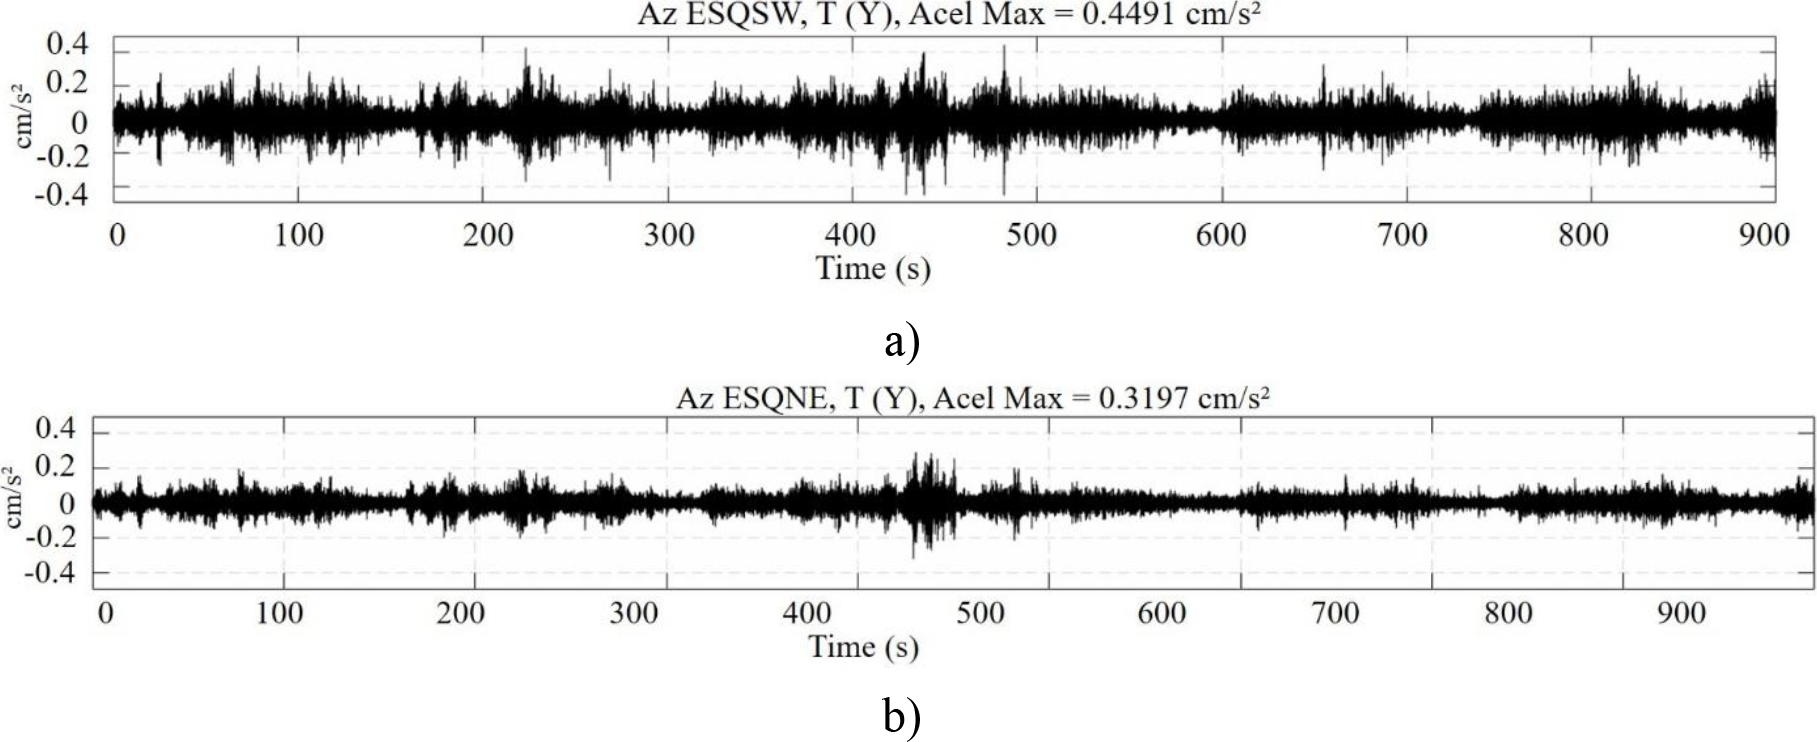
Figure 17. VA signals located to the southwest (SW) and northeast (NE); a) Az ESQSW T(Y); b) ESQNE T(Y).
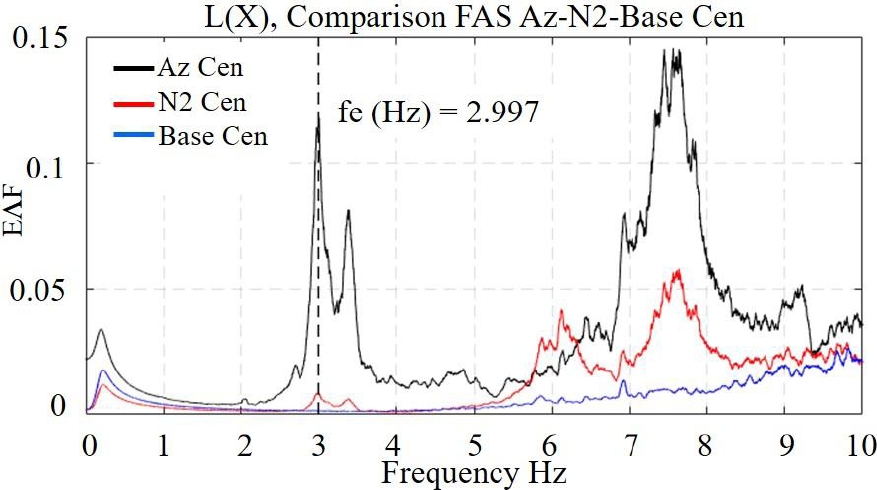
Figure 18. Frequencies in X. a) Fourier spectra of the Roof (Az), Level 2 (N2) and Ground Floor (Base) in direction L(X), located in the center to obtain translation modes. Where: EᴧF = signal amplitude in a specific frequency interval, FAS = transfer functions.
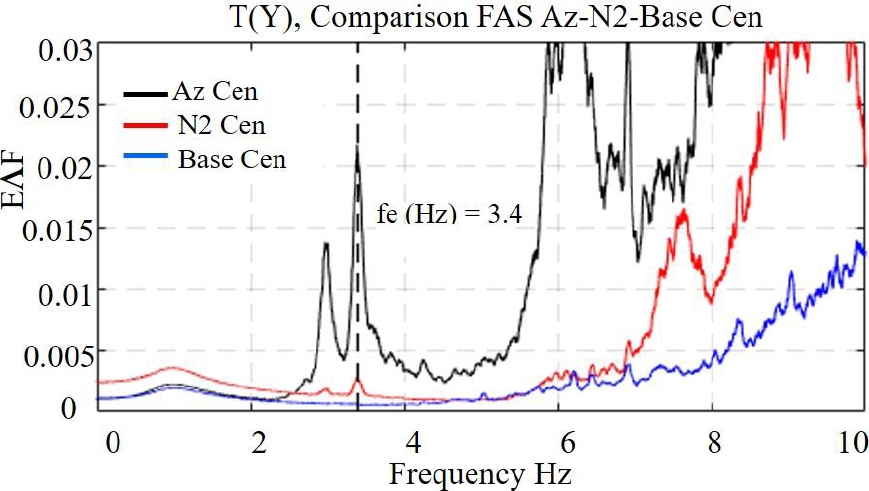
Figure 19. Frequencies in Y; a) Fourier spectra of the Roof (Az) Level 2 (N2) and Ground Floor (Base) in the T(Y) direction, located in the center to obtain translation modes.
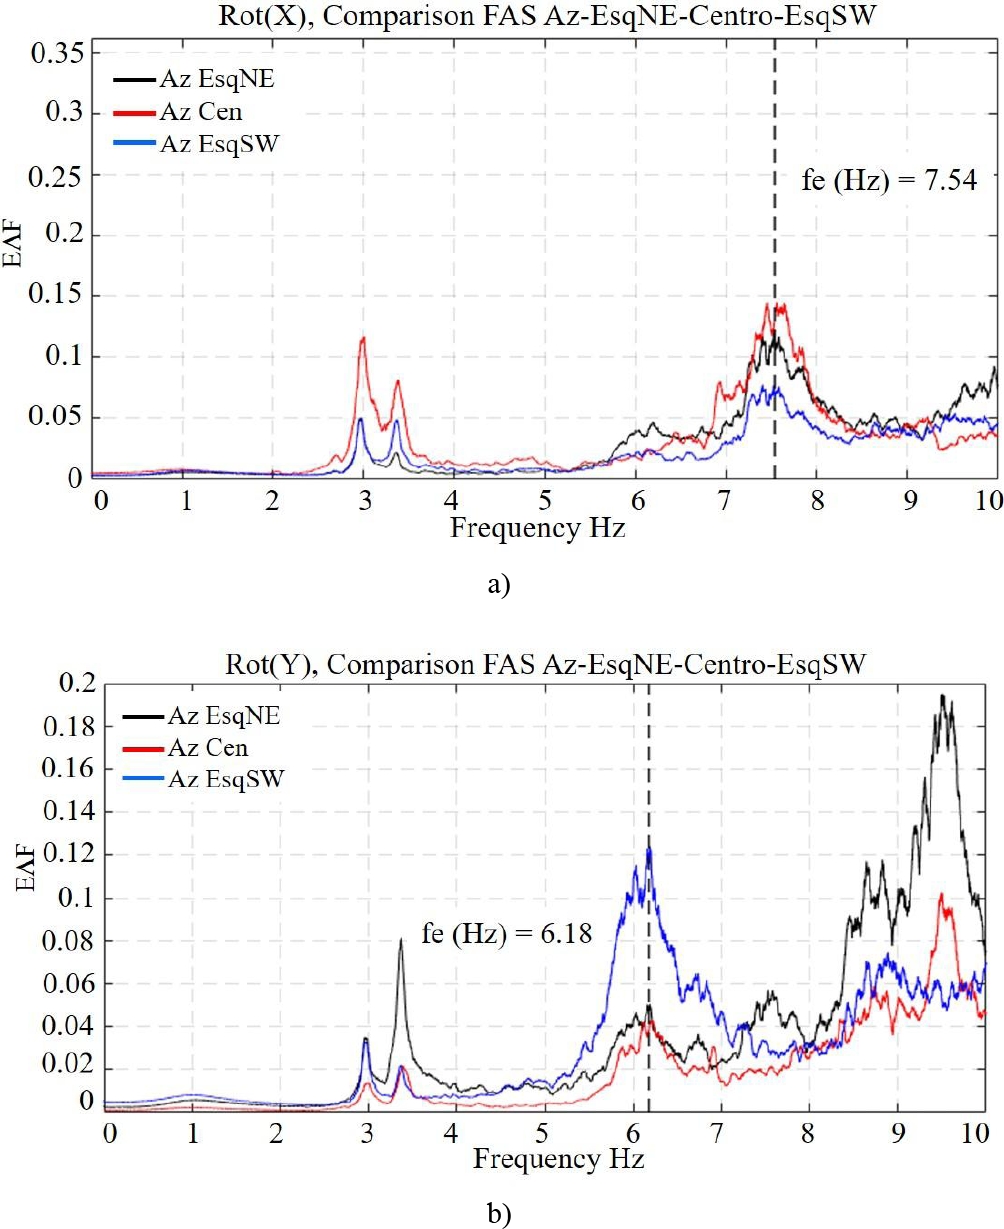
Figure 20. Fourier spectra for obtaining torsion modes; a) Northeast Corner Roof (Az EsqNE), Center Roof (Az Cen), and Southwest Corner Roof (Az EsqSW), direction L(X); b) Northeast Corner Roof (Az EsqNE), Center Roof (Az Cen) and Southwest Corner Roof (Az EsqSW), direction T(Y). Where: FAS = transfer functions, EᴧF = amplitude of the signal in a specific frequency interval.
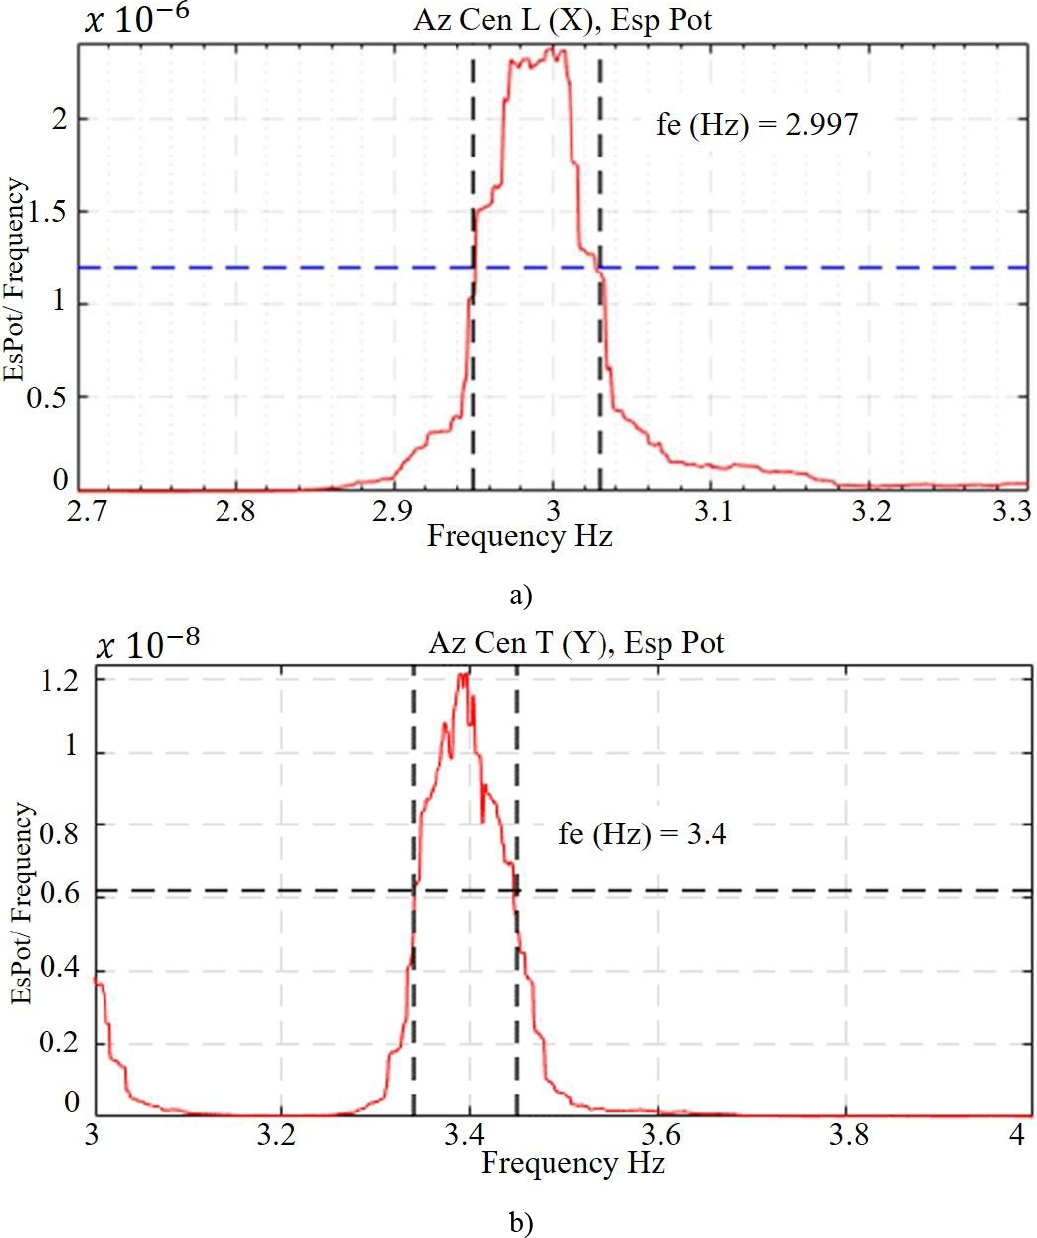
Figure 21. Power spectrum and frequency relationship graphs corresponding to L(X) and T(Y). a) Frequency close to 2.997 Hz in the L(X) direction; b) Frequency close to 3.4 Hz in the T(Y) direction. Where: Esp Pot = power spectrum.
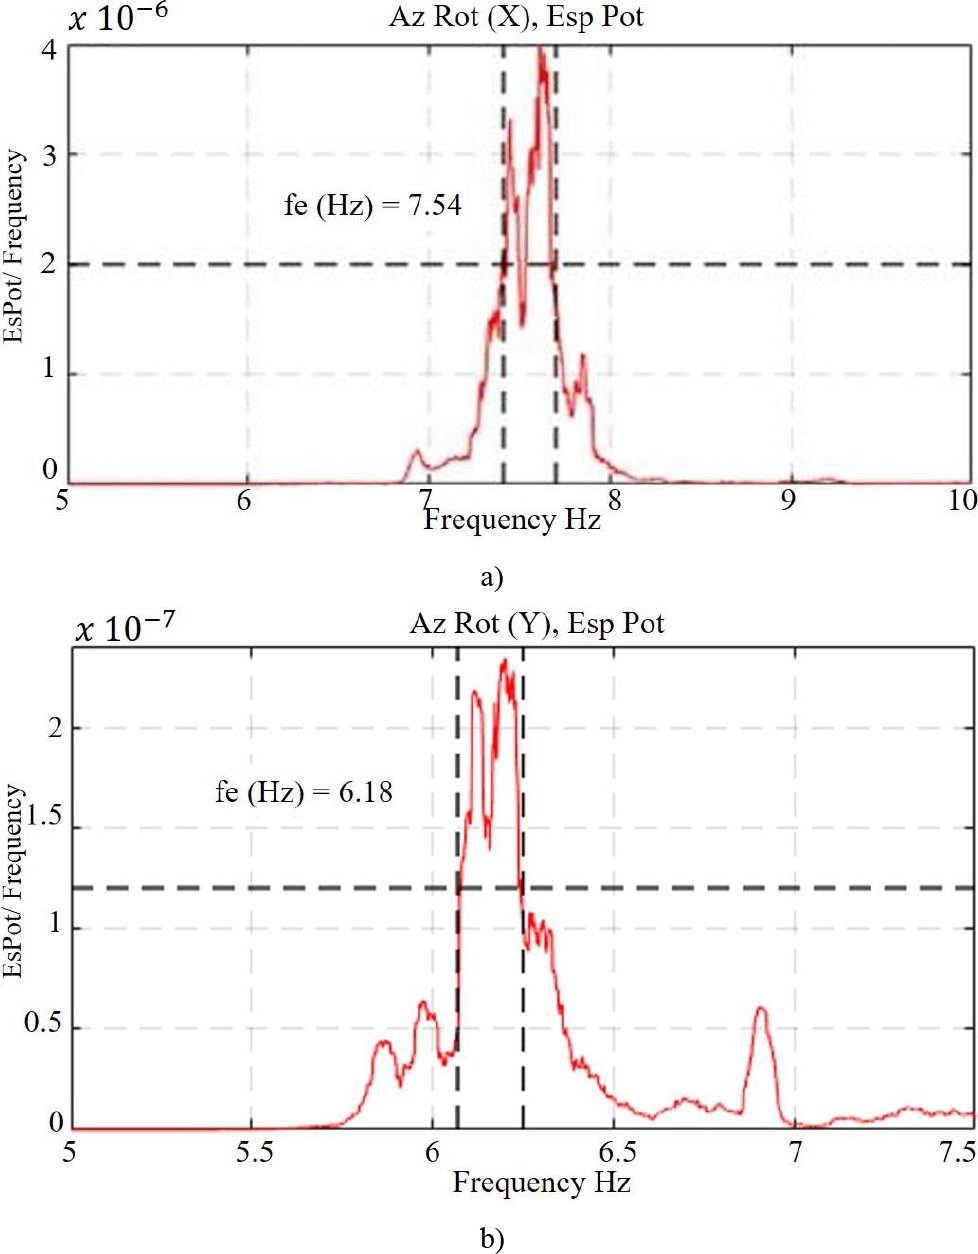
Figure 22. Power spectrum and frequency relationship graphs corresponding to rotation; a) frequency close to 7.54 Hz in the L(X) direction; b) frequency close to 6.18 Hz in the T(Y) direction.
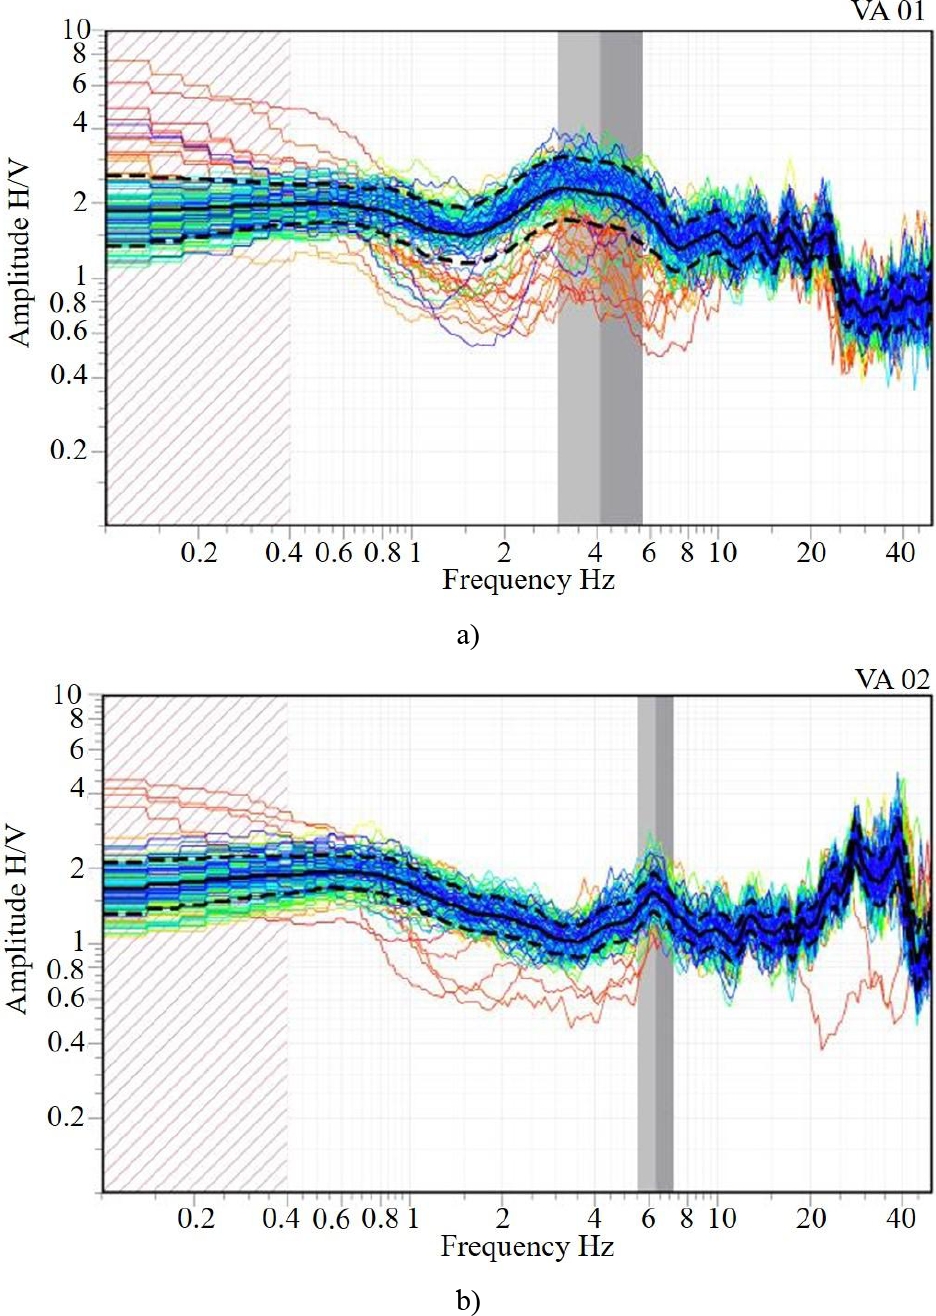
Figure 23. Empirical transfer function graphs; a) corresponding to CL1; b) corresponding to CL2. Where: H/V = Horizontal to vertical spectral ratio.
The frequencies in the L(X) and T(Y) directions are obtained from the Fourier spectra of the points measured at the center of the structure (Figures 18 and 19).
Fourier spectra of the corners measured on the roof were used to identify the torsion mode. Figure 20 shows the spectra in the L(X) and T(Y) directions.
Figures 21 and 22 show the application of the method developed by Kawasumi and Shima (1965) to determine the average value of the critical damping fraction.
The ground period (Figure 23) was determined using the Nakamura (H/V) technique, which was developed by Yutaka Nakamura (1989) using strong earthquakes. However, he first applied this technique to microtremors in urban areas in Japan, so it can be applied even to records of strong or weak seismic movements (Lermo et al., 1993. Nakamura, 1989).
4. STRUCTURAL TWIN
4.1 Boundary conditions
The following points were considered in the EA structural analysis: the existence of two adjacent structures labeled ALFA and GAMA that restrict the movement of the BETA building, so restrictions were placed in the structural model by means of springs, which represent the areas of physical contact between the buildings, which will eventually be partially demolished (ALFA and GAMA buildings) to ensure the separation of the seismic joints (Figure 24).
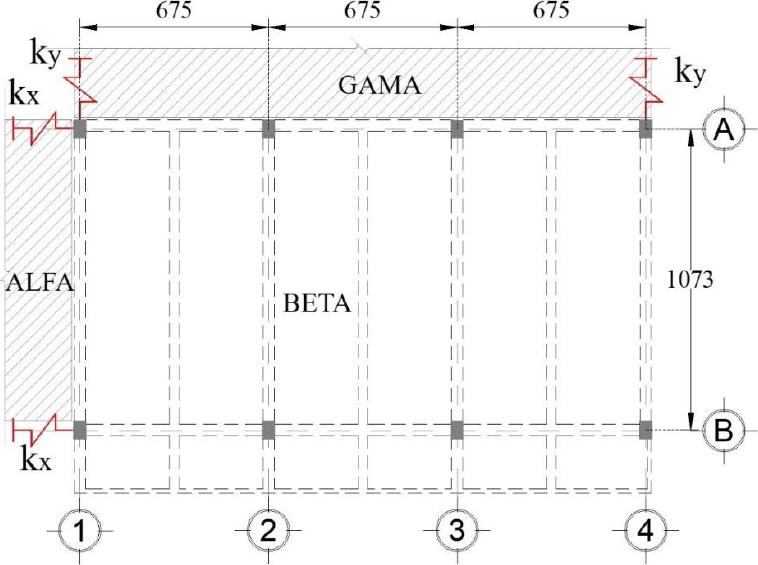
Figure 24. Assignment of springs in areas of physical contact between buildings (plan view, dimensions in cm).
On the other hand, Figures 25 and 26 show the different models of the case study considering the interactions between buildings and the foundation soil, so, for the current state, we have: SRCE = no springs in the foundation with contact between buildings, SRSE = no springs in the foundation without contact between buildings, CRCE = springs in the foundation with contact between buildings, CRSE = springs in the foundation without contact between buildings.
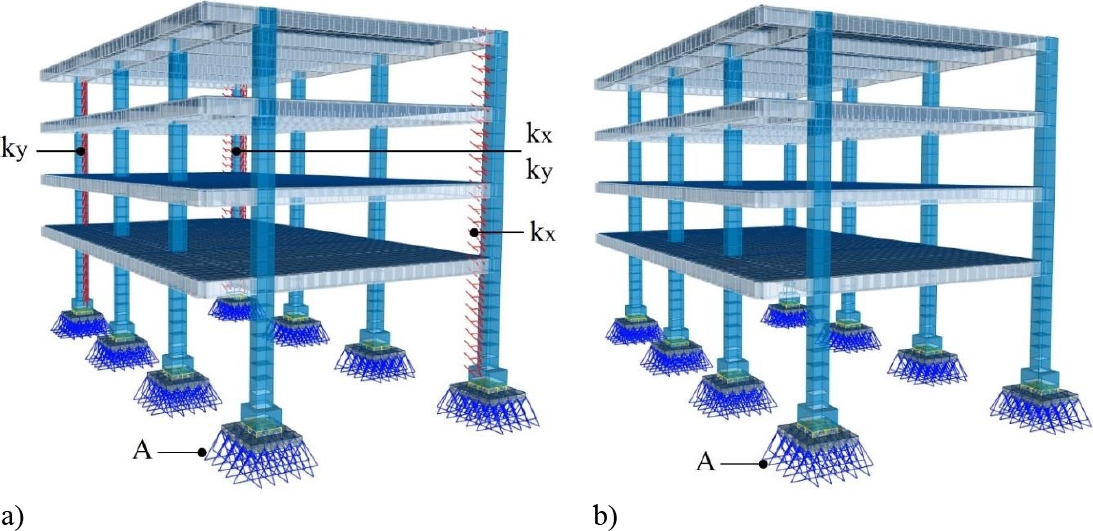
Figure 25. EA model with supported foundation; a) SRCE; b) SRSE, where: kx = contact spring in X direction (7000 kg/cm), ky = contact spring in Y direction (13000 kg/cm), A = infinitely rigid support.
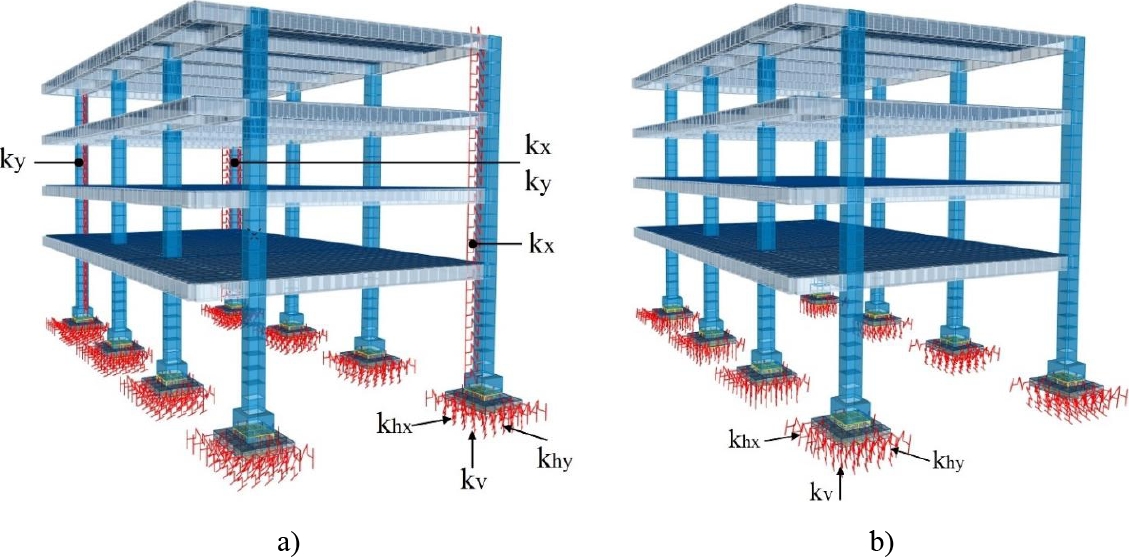
Figure 26. EA model with soil-structure interaction; a) CRCE); b) CRSE, where: kx = 7000 kg/cm, ky = 13000 kg/cm, khx = horizontal contact spring in X (5745 kg/cm), khy = horizontal contact spring in Y (5745 kg/cm), kv = vertical spring (9575 kg/cm).
The mathematical model represents the EA of the reinforced concrete BETA building, consisting of a ground floor and three upper floors, simulated in SAP2000 with a total of 5,230 nodes. The structure is composed of column and beam frames, solid floor slabs, and isolated footings (Figures 25 to 27).
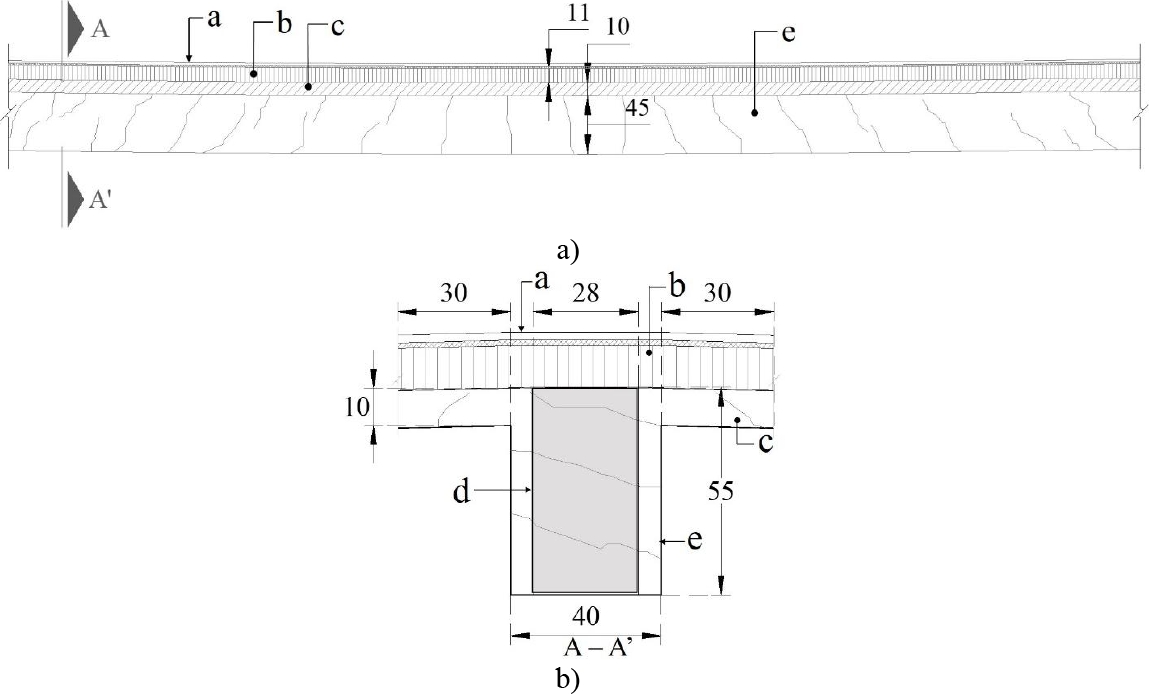
Figure 27. EA reinforced concrete beams; a) longitudinal view; b) cross-sectional view. Where: a = floor finish, b = unreinforced concrete fill, c = reinforced concrete slab, d = transformed section of concrete beam considered for the calculation of the cracked moment of inertia, e = cracked reinforced concrete beam, dimensions in cm.
For the calibration of the mathematical rehabilitation model, a weighted value of the elastic modulus of concrete calculated using equation (1) was considered, based on the results obtained from laboratory tests (Ecl), because when new concrete is integrated into existing elements, the elastic modulus as a composite section is modified due to the interaction of the materials.
| (1) |
Ecp = weighted modulus of elasticity.
= área of the i-th section that make up the clad column.
= i-th elastic modulus of the section that makes up the clad column.
i = i-th (1 to n)
n = number of sections comprising the clad column.
In this way, the weighted value of Ecp = 216530 kg/cm² was obtained for concrete-coated elements (columns), and an elastic modulus value of Ecn = 221359.44 kg/cm² was considered for new concrete. For existing concrete elements, the average of the existing elastic moduli obtained from laboratory tests (Ecl) was calculated, which was 206890 kg/cm². On the other hand, the average of the resulting theoretical elastic modulus related to the sclerometer tests (Ece) was calculated, which was 286171 kg/cm².
5. PROPOSALS FOR REINFORCEMENT
By not considering mechanical connectors in the contact section, the existing beams and steel reinforcement profiles work separately, generating two independent neutral axes, as well as slippage between the contact edges. On the other hand, composite beams work as a single element due to the presence of mechanical connectors, forming a single neutral axis, eliminating slippage between elements and increasing their stiffness (Figures 28 to 32). (de Buen López, 2004; Salmon and Johnson, 1996; McCormac and Csernak, 2013; Segui, 2000; Gere and Goodno, 2016).
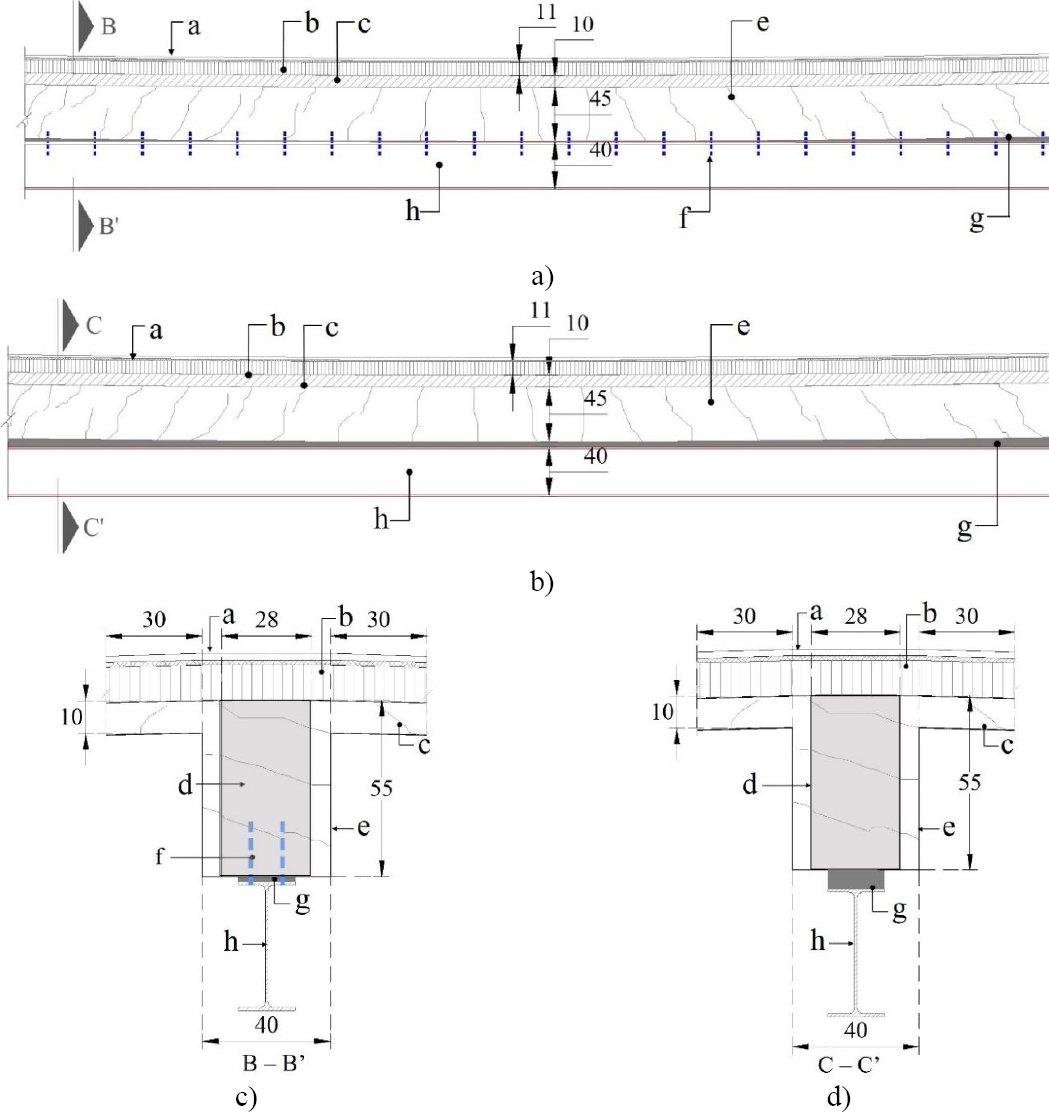
Figure 28. Main beam reinforcement; a) longitudinal view of composite beam; b) longitudinal view of contact beam; c) cross-sectional view (B-B'); d) cross-sectional view (C-C'); where: a = floor finish, b = unreinforced concrete fill, c = reinforced concrete slab, d = transformed section of concrete beam considered in accordance with the decrease in moment of inertia, e = cracked reinforced concrete beam, f = projection of connectors between the two elements, g = non-metallic grout filling, h = A-50 steel profile (IR 406 mm x 53.70 kg/m). Dimensions in cm.
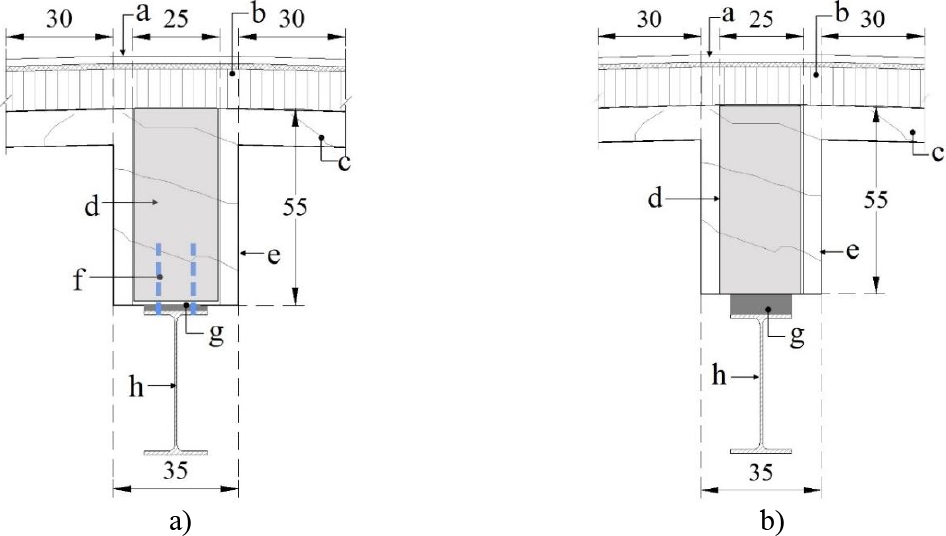
Figure 29. Secondary beam reinforcement; a) cross-section of composite beam; b) cross-section of contact beam; where: a = floor finish, b = unreinforced concrete fill, c = reinforced concrete slab, d = transformed section of concrete beam considered in accordance with the decrease in moment of inertia, e = cracked reinforced concrete beam, f = projection of connectors between the two elements, g = non-metallic grout fill, h = A-50 steel profile (IR 406 mm x 53.70 kg/m). Dimensions in cm.
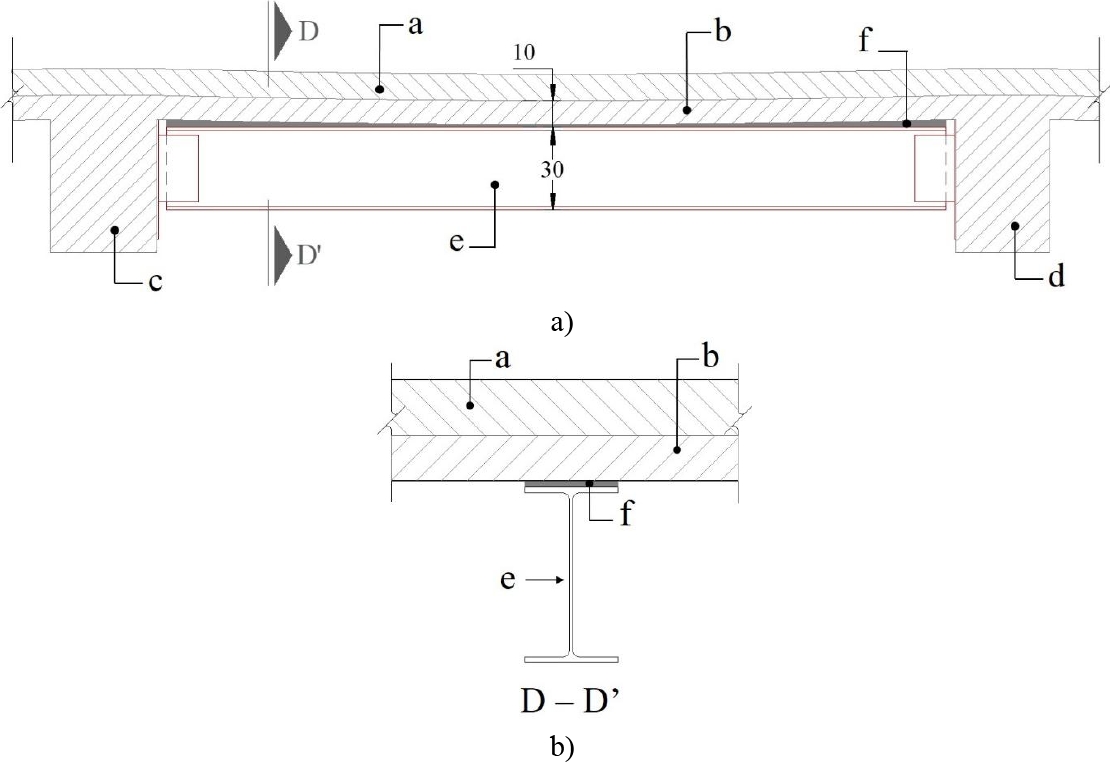
Figure 30. Tertiary beam to support the solid reinforced concrete slab; a) longitudinal view; b) cross-sectional view; where: a = unreinforced concrete fill, b = reinforced concrete slab, c = main reinforced concrete beam, d = secondary reinforced concrete beam, e = A-50 steel profile (IR 305 mm x 38.70 kg/m), f = non-metallic grout fill.
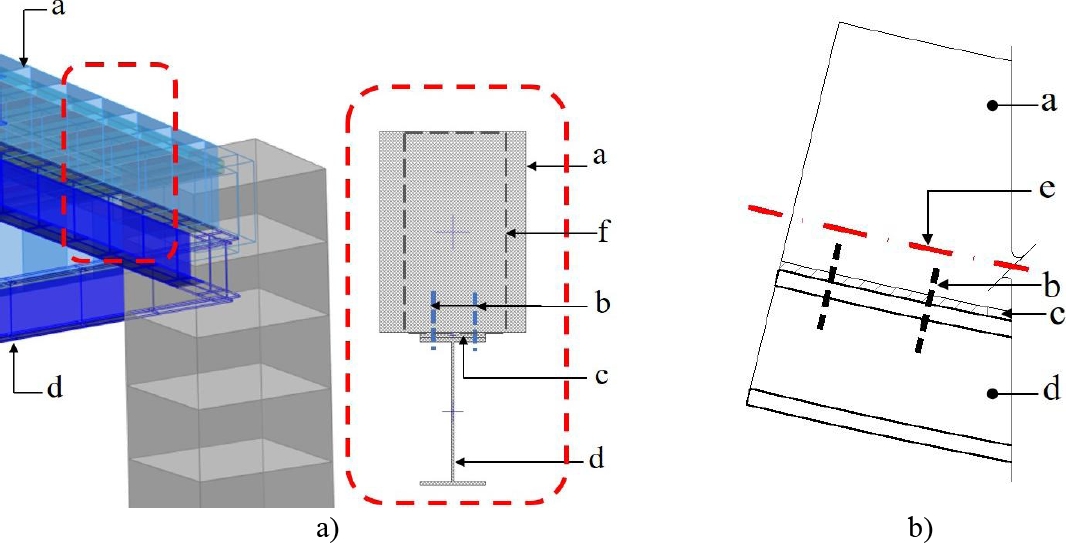
Figure 31. Composite main beams; a) structural model with composite beams; b) detail of composite beam; where: a = cracked reinforced concrete beam, b = mechanical connector, c = non-metallic grout, d = steel beam, e = neutral axis, f = transformed section of concrete beam considered in accordance with the decrease in moment of inertia.
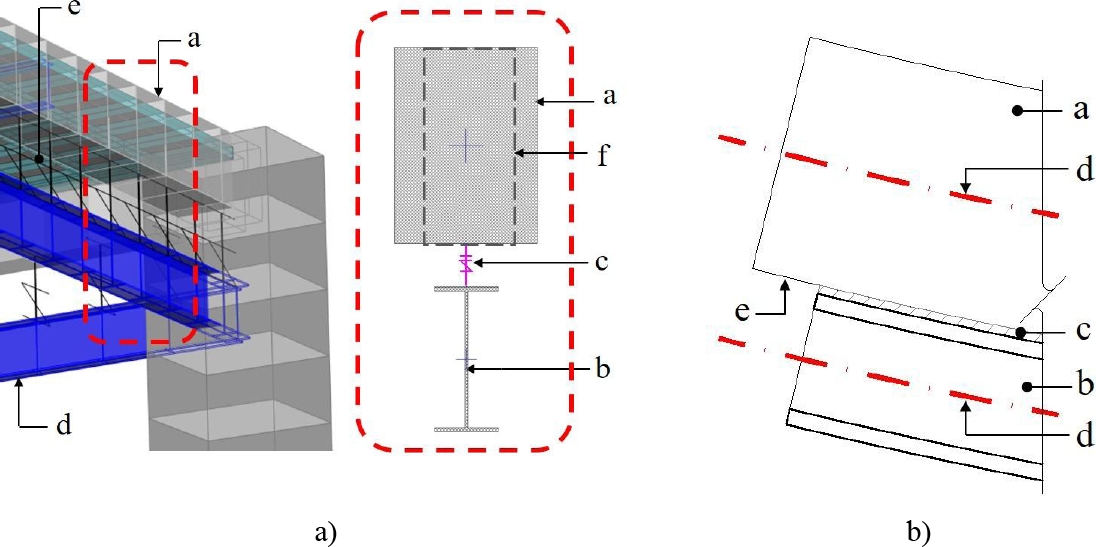
Figure 32. Main contact beams; a) structural model with contact beams with gaps; b) detail of contact beam; where: a = cracked reinforced concrete beam, b = steel beam, c = contact gap element, d = neutral axis, e = sliding between structural elements, f = transformed section of concrete beam considered in accordance with the decrease in moment of inertia.
In order to restore the initial or adequate rigidity to rehabilitate the structural behavior, it was decided to reinforce the existing columns with reinforced concrete cladding. Likewise, the foundation, which currently consists of isolated footings, is reinforced with a system of continuous footings and tie beams (Figures 33 and 34).
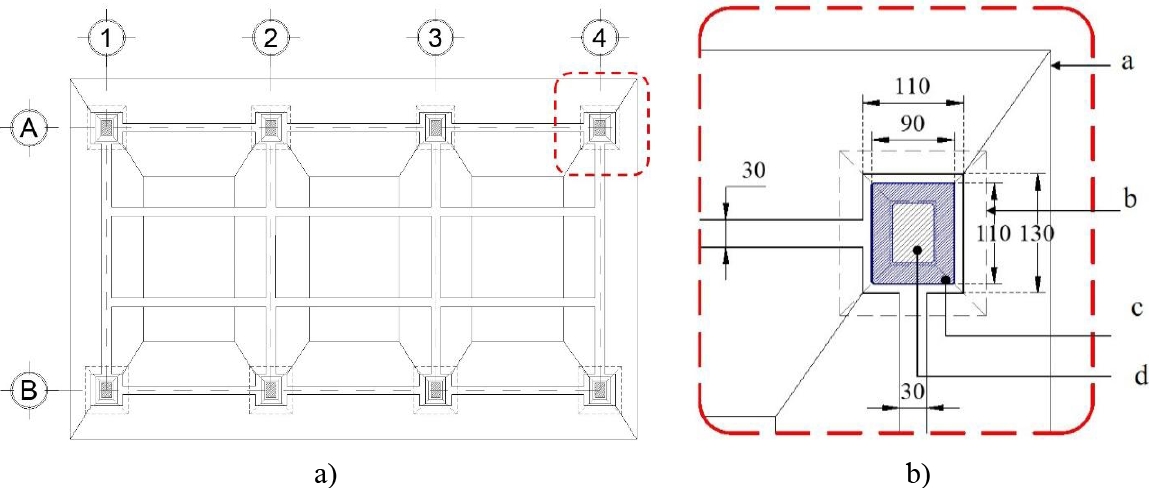
Figure 33. Cladding on columns and foundations; a) plan view of the clad foundation; b) plan view of the cladding on the existing reinforced concrete footing and column; where: a = foundation reinforcement based on continuous footings, b = projection of existing isolated footing, c = reinforced concrete cladding on existing column, d = existing reinforced concrete column.
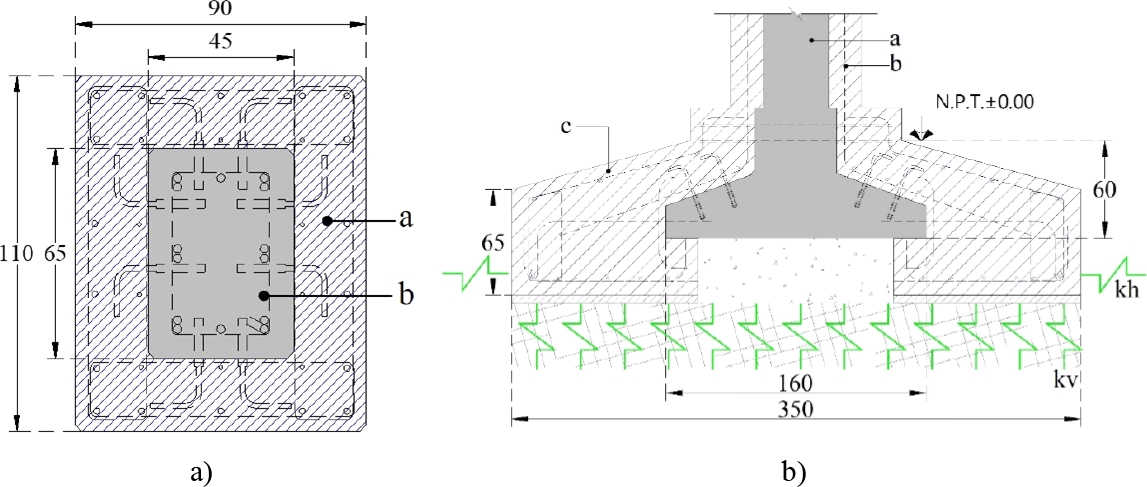
Figure 34. Details of column and foundation reinforcement; a) reinforcement of existing reinforced concrete column; b) reinforcement of existing reinforced concrete foundation; where: a = column reinforcement using reinforced concrete cladding, b = existing reinforced concrete column, c = foundation reinforcement using strip footings. Dimensions in cm.
6. COMPARISON OF DYNAMIC BEHAVIOR BETWEEN THE STRUCTURAL TWIN AND THE REINFORCED MODEL
Based on mathematical models, the periods associated with the building's vibration modes in different cases were determined (Table 3).
Table 3. Periods associated with vibration modes.
| Case Study | T(s) | ||
| M1 | M2 | M3 | |
| SRCE (EA) | 0.35 | 0.30 | 0.19 |
| SRSE (EA) | 0.85 | 0.83 | 0.69 |
| CRCE (EA) | 0.85 | 0.45 | 0.41 |
| CRSE (EA) | 1.03 | 1.0 | 0.84 |
| SRTC | 0.48 | 0.40 | 0.37 |
| SRTCM | 0.42 | 0.39 | 0.34 |
| CRTC | 0.47 | 0.39 | 0.36 |
| CRTCM | 0.40 | 0.38 | 0.33 |
Table 3 shows that, in the first case, vibration modes M1, M2, and M3 for the EA of the SRCE case practically reached the periods determined with the VA, which is why the base mathematical model was calibrated. On the other hand, Figures 35 to 42 show the vibration modes of each case mentioned in Table 3 graphically.
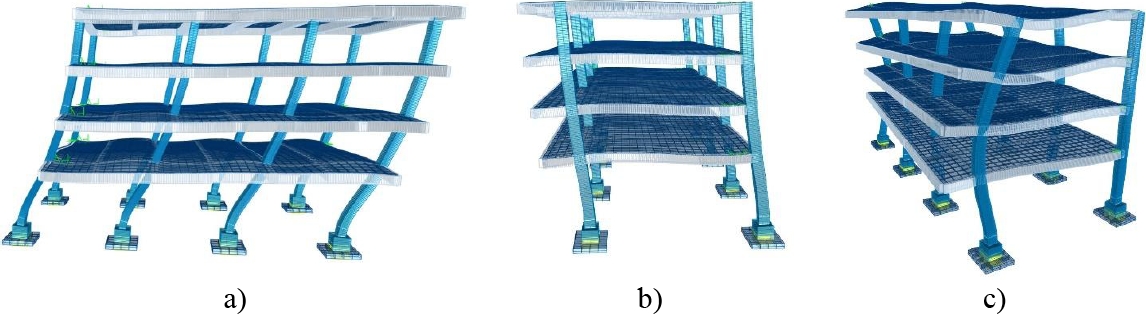
Figure 35. Vibration modes in SRCE; a) M1; b) M2; c) M3.

Figure 36. Vibration modes in SRSE; a) M1; b) M2; c) M3.
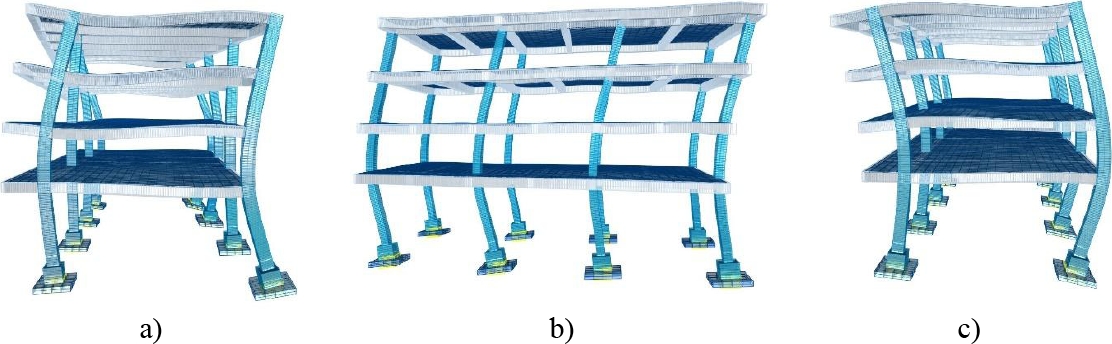
Figure 37. Vibration modes in CRCE; a) M1; b) M2; c) M3.
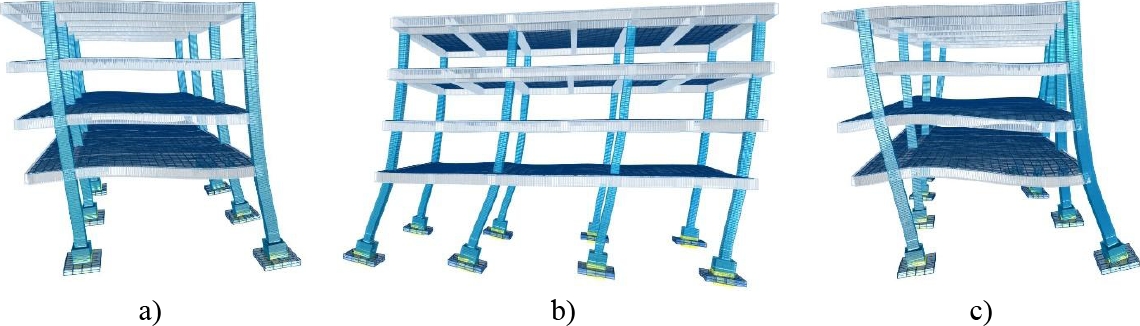
Figure 38. Vibration modes in CRSE; a) M1; b) M2; c) M3.
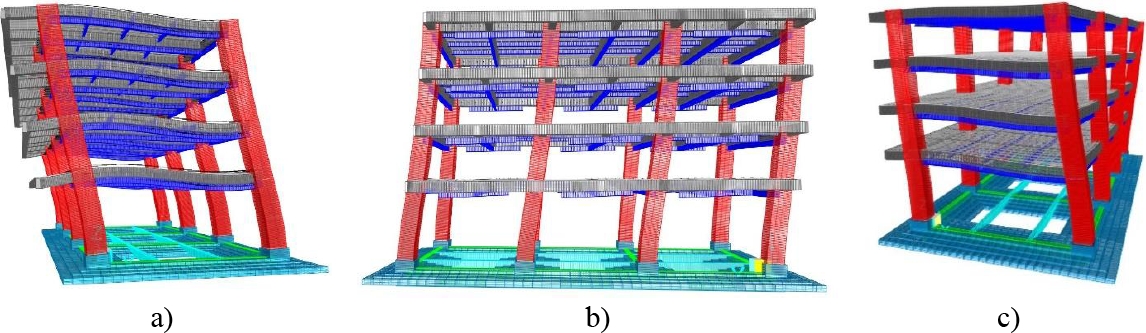
Figure 39. Vibration modes in SRTC; a) M1; b) M2; c) M3.

Figure 40. Vibration modes in SRTCM; a) M1; b) M2; c) M3.
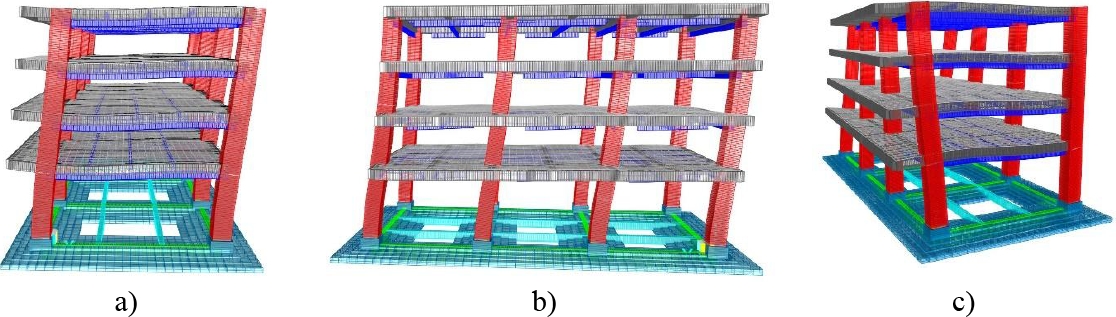
Figure 41. Vibration modes in CRTC; a M1; b) M2; c) M3.
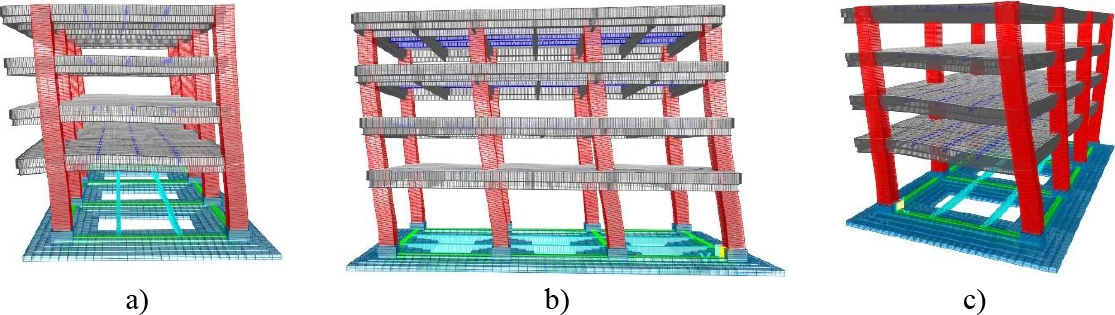
Figure 42. Vibration modes in CRTCM; a) M1; b) M2; c) M3.
7. RESULTS AND DISCUSSION
Based on the above, the displacements and distortions of all cases (Figures 43 to 46) were obtained in accordance with NTC-Sismo (2023).
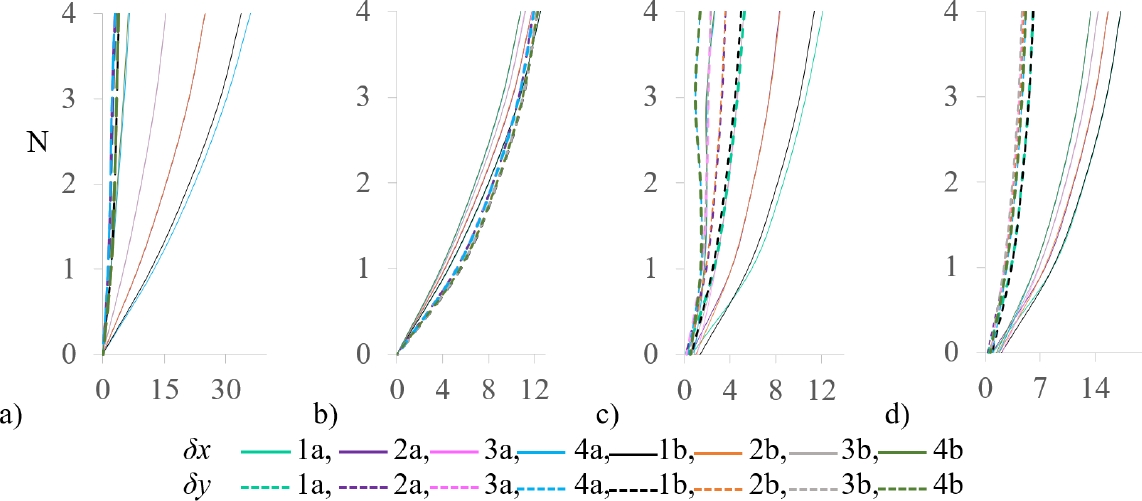
Figure 43. Lateral displacements (δ) in EA; a) δ in X and Y (SRCE); b) δ in X and Y (SRSE); c) δ in X and Y (CRCE); d) δ in X and Y (CRSE), where: N = Floor level, δx = displacements in the X direction, δy = displacements in the Y direction. δ in cm.
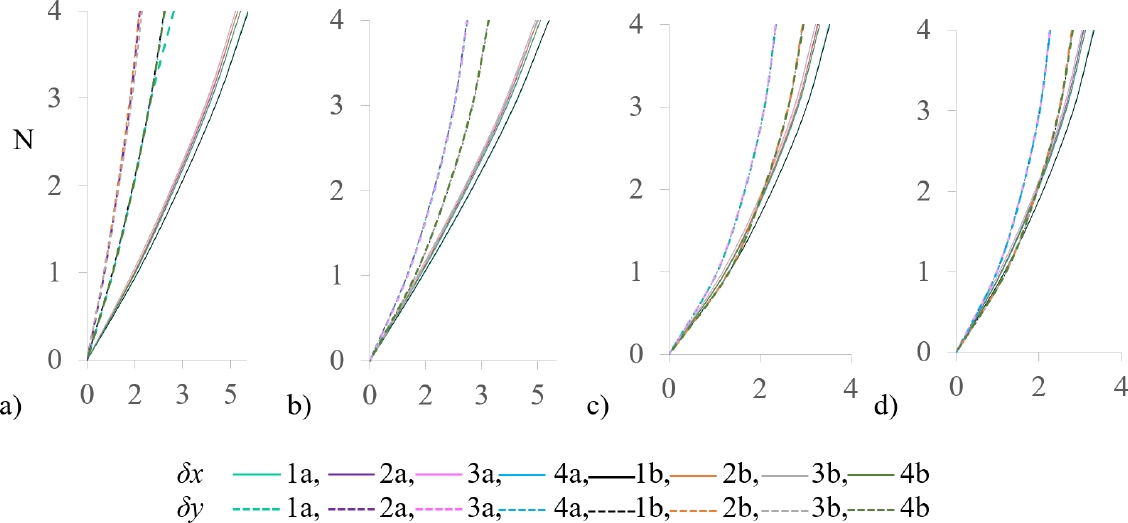
Figure 44. Lateral displacements (δ) in reinforced building; a) δ in X and Y (SRTC); b) δ in X and Y (SRTCM); c) δ in X and Y (CRTC); d) δ in X and Y (CRTCM), where: N = Floor level, δx = displacements in the X direction, δy = displacements in the Y direction. δ in cm.
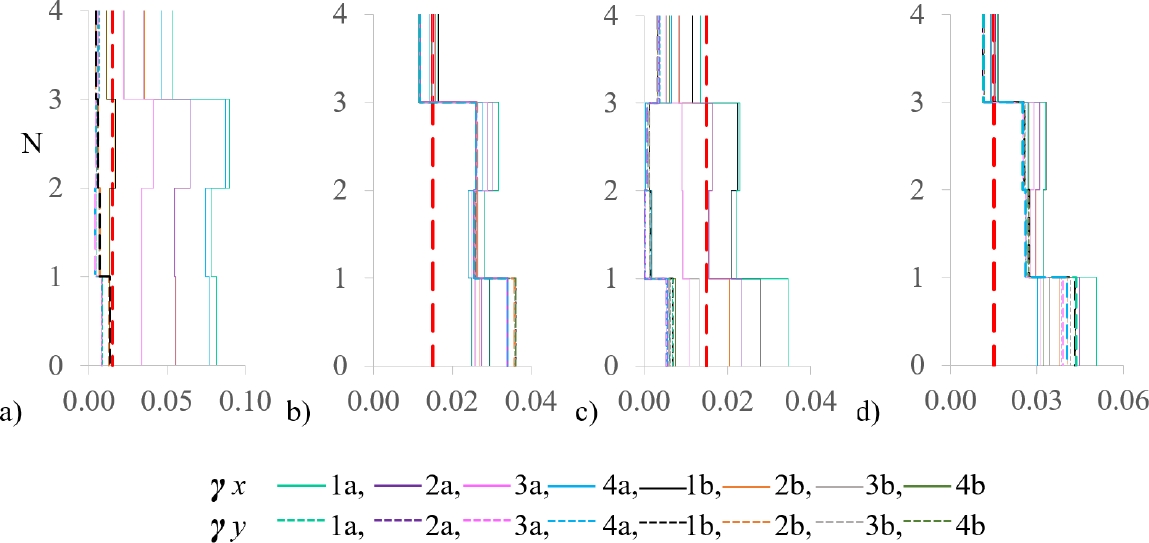
Figure 45. Drift ratio (γ) in EA on the axes of the structural system; a) γ in X and Y (SRCE); b) γ in X and Y (SRSE); c) γ in X and Y (CRCE); d) γ in X and Y (CRSE). Where: γL = Limit drift ratio NTC-Sismo (2023), N = floor level.
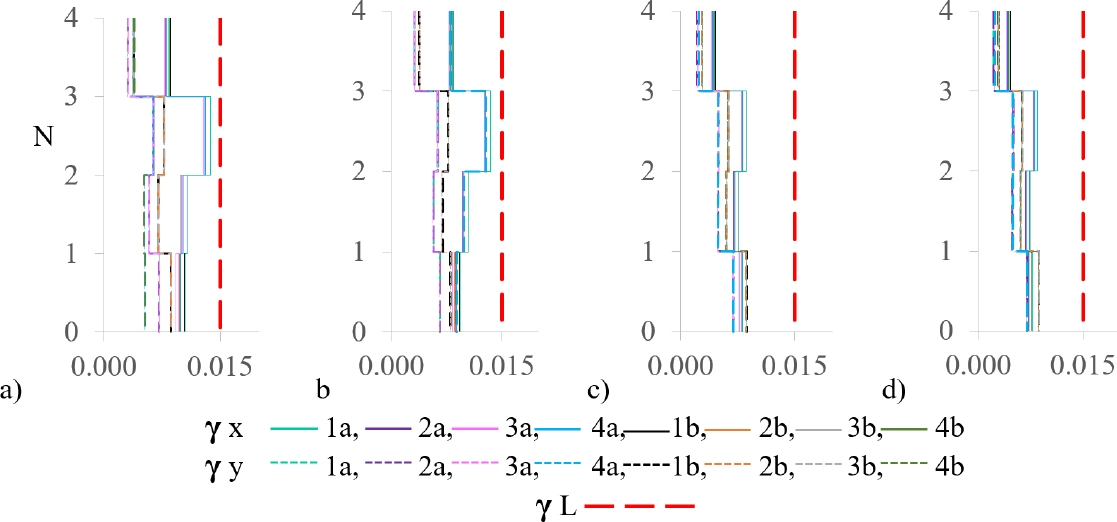
Figure 46. Drift ratio (γ) in reinforced buildings on the axes of the structural system; a) γ in X and Y (SRTC); b) γ in X and Y (SRTCM); c) γ in X and Y (CRTC); d) γ in X and Y (CRTCM). Where: γL = Limit drift ratio NTC-Sismo (2023), N = floor level.
Based on the structural analysis of the building in EA and reinforced structure, stress concentrations (in kg/cm²) were identified in the elements (Figures 47 to 50).
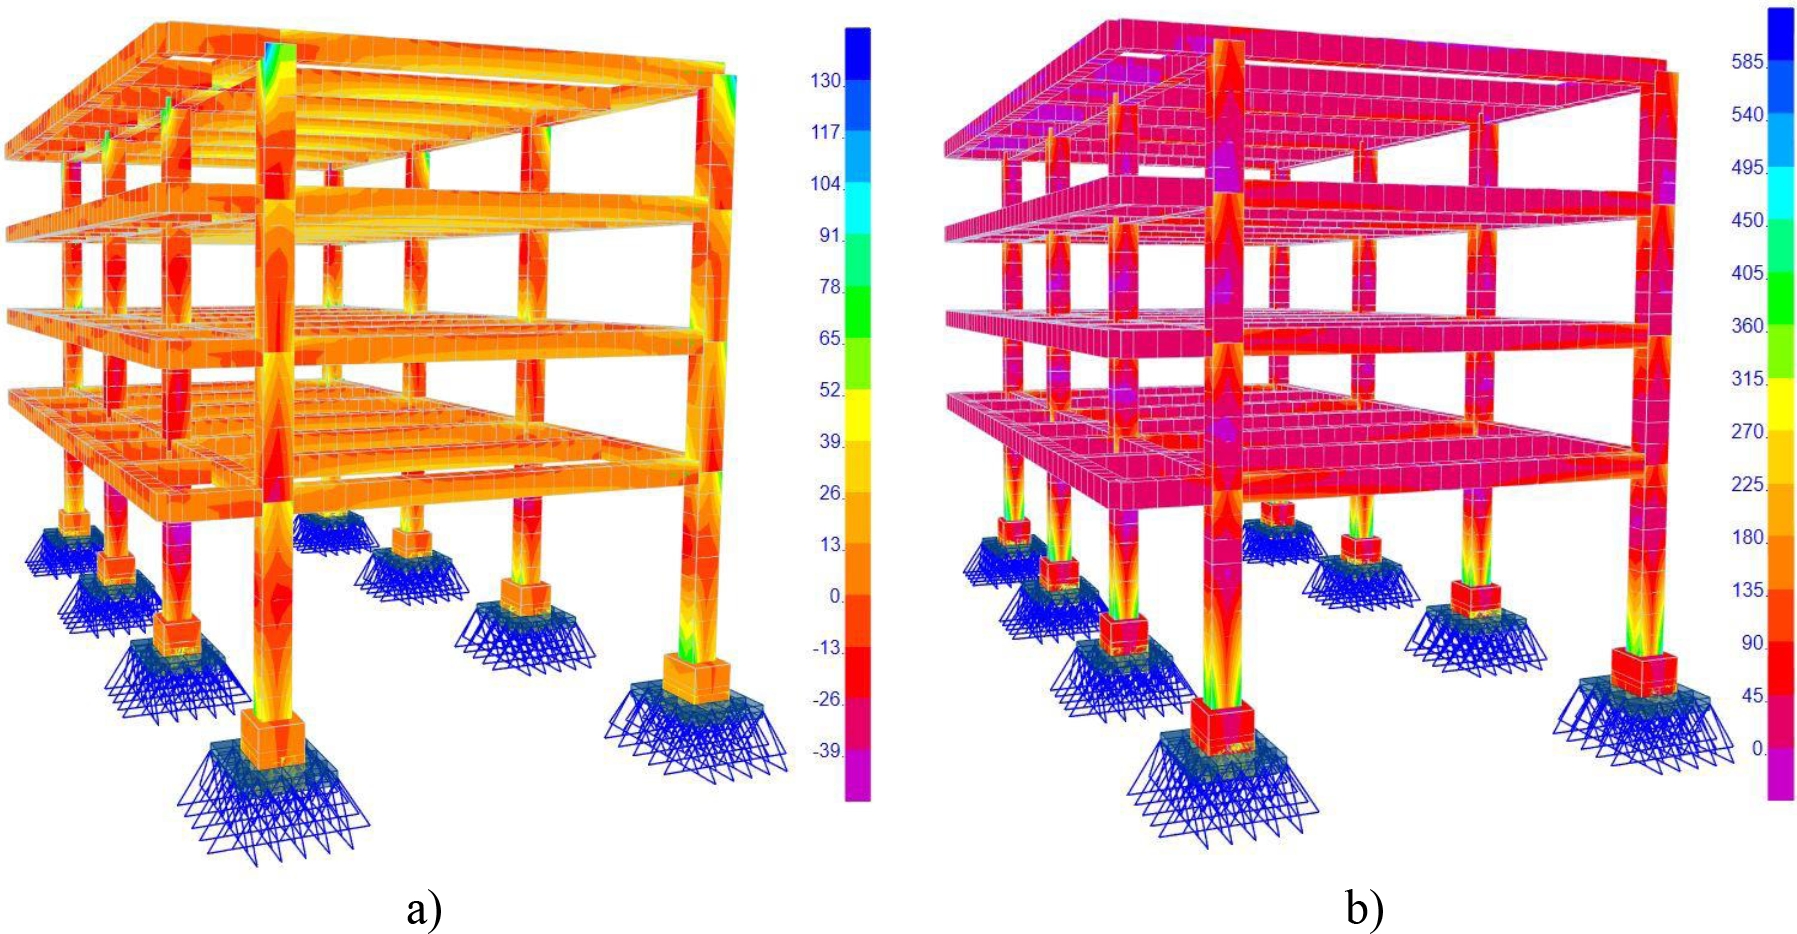
Figure 47. Stress concentration in EA without soil-structure interaction (ISE); a) SRCE; b) SRSE.
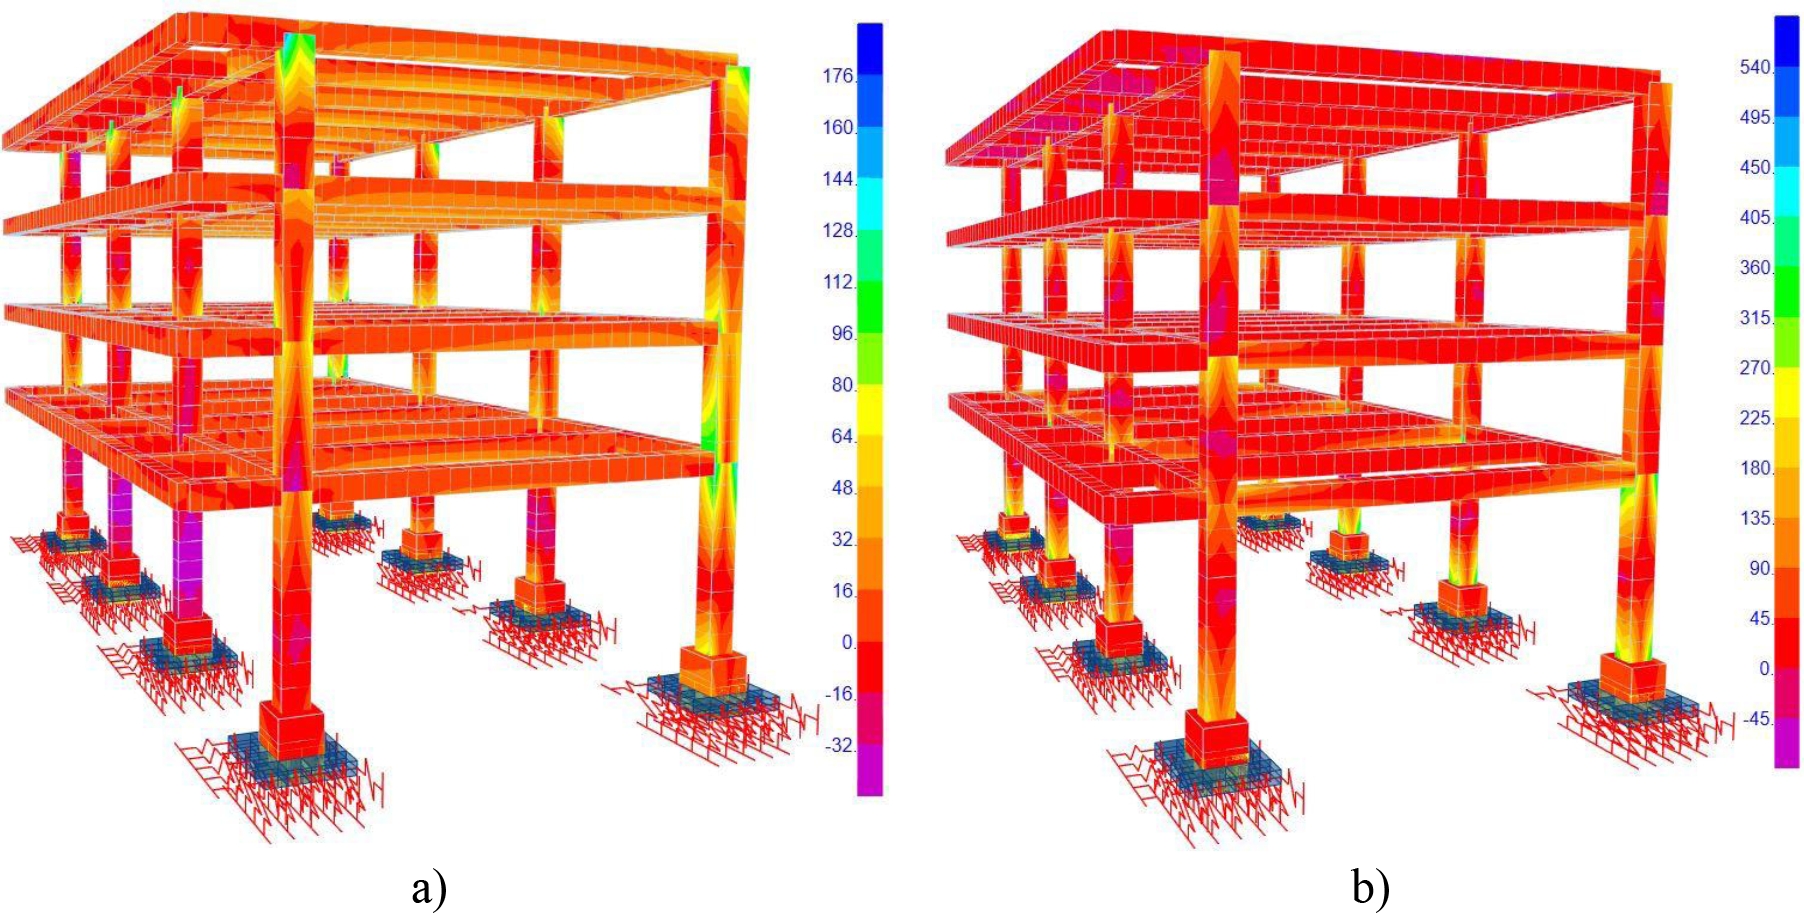
Figure 48. Stress concentration in EA with ISE; a) CRCE; b) CRSE.
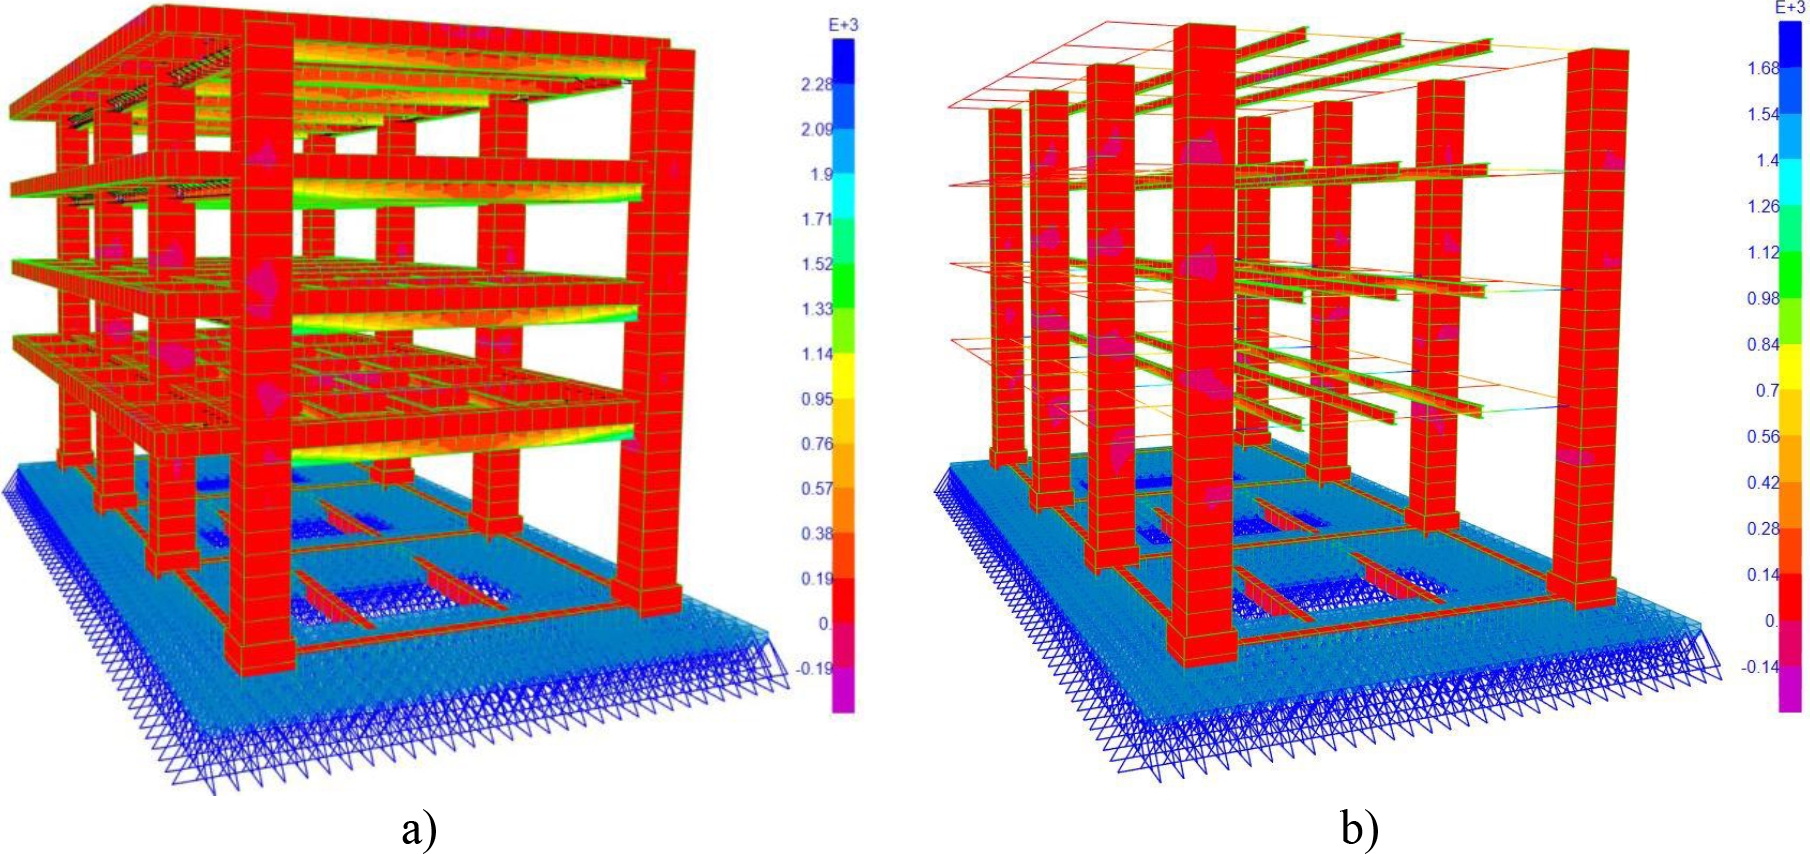
Figure 49. Stress concentration of cases without ISE; a) SRTC; b) SRTCM. Note: the model shown in Figure 49b does not show the extruded composite beams, because the software only recognizes the extrusion of preloaded sections, showing only their color-coded relationship to the stresses.
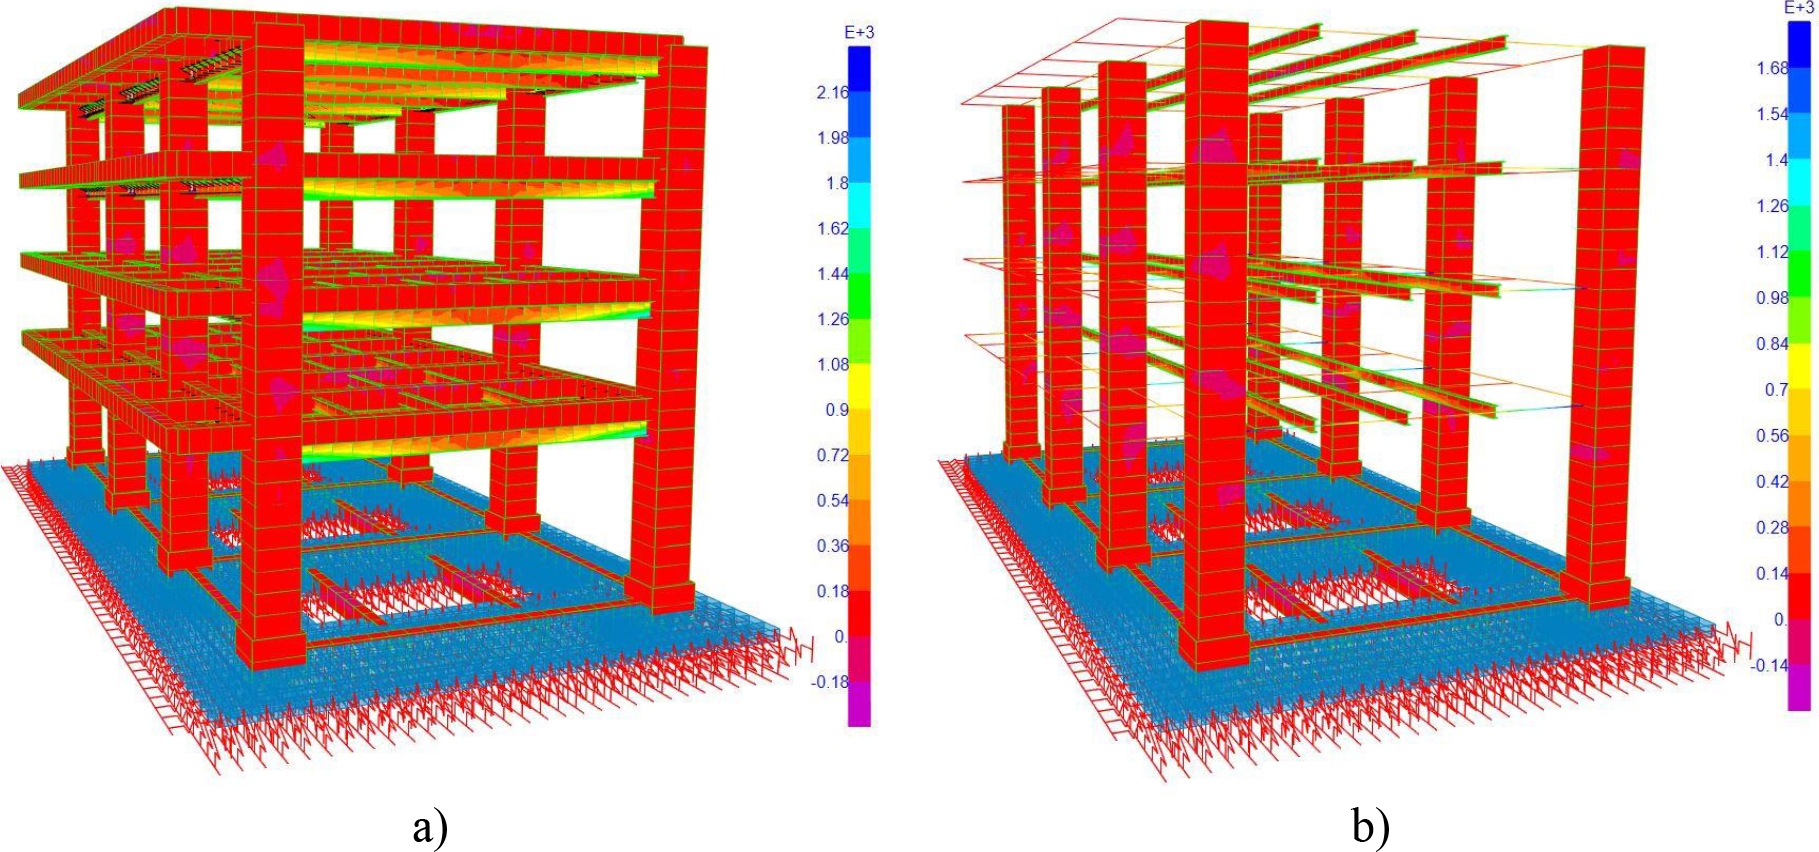
Figure 50. Stress concentration of cases with ISE; a) CRTC; b) CRTCM. Note: the model shown in Figure 50b does not show the extruded composite beams, because the software only recognizes the extrusion of preloaded sections, showing only their color-coded relationship to the stresses.
For the case study, a difference was determined between the elastic moduli of the existing structure (Ecl) and the theoretical elastic modulus of the new concrete (Ecn), the latter used to simulate the column cladding. This difference was obtained using the Ecn/Ecl ratio, which was approximately 7%. On the other hand, the difference in the Ece/Ecl ratio was approximately 38%. Obtaining the Ece/Ecn ratio resulted in a difference of 29%. Likewise, the compressive strength (f'c) determined with the sclerometer tests was 421 kg/cm² on average and a median of 418 kg/cm², which differs from the f'c obtained directly from the laboratory tests, which was 335 kg/cm² on average, resulting in a difference in the f'c ratio between the two tests of approximately 25%. This shows that the f'c in older buildings, with a certain level of deterioration, or even new buildings, may not comply with the theoretical Ec stipulated in the regulations. On the other hand, in order to determine the dynamic properties of the structure in its current state, VA tests were performed. Measurements were taken using a SARA Geobox seismometer and five KINEMETRICS K2 triaxial accelerometers, with sensors that directly record vibrations in three orthogonal directions at each of the selected measurement points. The base model was also calibrated, where the periods obtained with VA associated with modes 1, 2, and 3 were 0.33s, 0.29s, and 0.16s, respectively. In addition, the predominant soil periods in CL1 and CL2 were identified with values of 0.24s and 0.16s, respectively. Likewise, when reviewing the capacity of the EA foundation, a deficiency was observed in terms of its footing surface. In addition, the weight of the structure was increased due to the addition of reinforcement elements and column cladding. For this reason, and considering the characteristics revealed by the soil mechanics study, it was decided to reinforce it (Figures 9, 33, and 34). The composite beam model showed better performance in terms of displacement and drift ratio compared to the contact beam model (Figures 43 and 45), while the composite beam model further reduced the fundamental periods (Table 3). It should be noted that both reinforcement considerations comply with the reduction of drift ratio and the limits indicated in NTC-Sismo-2023. However, from a construction standpoint, composite beams require greater care when connecting steel beams to cracked concrete beams. For this reason, it was decided to simulate the models with the same size steel beams, since in the event of failure due to resistance in the composite beam system, the steel reinforcement beams will perform at least as well as the contact beams.
When simulating the structure of the building in contact with other bodies, greater displacements were observed. This was due to the impact of such contact (Figures 43a and 43c), due to the modification of the center of stiffness in the body labeled BETA, since when interacting with the ALFA and GAMA bodies, the columns of axes 2a, 2b, 3a, 3b, and 4b are practically free.
The difference in displacements between the structure in its current state, without considering contact with secondary bodies, and the reinforced structure was 25 cm (Figures 43 and 44). This significantly reduced the drift ratio, bringing them within the permissible range (Figures 45 and 46).
For this case study, the effect of carbonation and durability on the service life of concrete was not considered. Likewise, corrosion in steel occurs in secondary elements and in very few areas of the building, which does not contribute to the lateral rigidity of the building, such as slabs and some edge beams. However, it is important and advisable that future work takes this corrosion into account and compare the results. Regarding the concentration of forces in the EA, it can be observed that these tend to be magnified at the junction of beams with columns and at the connections of columns with foundations (Figures 47 and 48), putting the structure at risk, since a failure in a vertical element makes the entire system vulnerable. In the models where composite beams, contact beams, column cladding, and foundations were integrated, it is evident that the stress concentration was redistributed throughout the system and mainly in the new steel beams (Figures 49 and 50), decreasing its concentration and balancing these stresses in the materials of the different elements.
8. CONCLUSIONS
It can be concluded that the degradation of materials over time, as well as the lack of preventive maintenance, led to a decrease in the rigidity of the system's constituent elements. This significantly modified the dynamic properties of the structure, showing an increase in vibration periods, as well as lateral displacements and drift ratio of the structure. Once the physical auscultation has been carried out, mixed tests are of utmost importance prior to modeling and structural analysis, since, by reading the building, the structural system in its current state can be understood more precisely. Through this process, the degree of deterioration in the building's behavior can be determined more accurately, as well as the current state of structural health in the face of lateral displacement effects (service condition).
The analysis of the physical and mechanical properties of materials, soil, and dynamic properties is essential for calibrating models and determining structural drift ratio. On the other hand, sclerometer tests alone yielded considerably high elastic moduli compared to those obtained from laboratory tests. When steel beams were installed to restore the diaphragm floor and control these deflections, they increased the weight of these floors, and since the objective was to improve lateral drift ratio, the columns were clad with reinforced concrete to increase lateral stiffness, as the use of diagonal elements was not permitted for reasons of preserving the functionality of the architectural spaces.
It is important to note that there are many procedures and materials available for rehabilitating drift ratio. However, in the case studied, the reinforcement elements were required and conditioned by the architectural design discipline in terms of the use of steel beams in the lower bed of the existing slabs and concrete beams, given that these present considerable deformations and deflections, which is currently causing, among other effects, the floor slabs not to function as completely rigid diaphragms, in addition to the aspect ratio between the main beams and the columns of the building in its EA not complying with the required condition of weak beam and strong column.
On the other hand, it was decided to intervene in the secondary buildings ALFA and GAMA to separate the structures and ensure the relevant seismic joints, thereby eliminating the tendency for continuity due to contact between structures. The models that include reinforcement showed that, in addition to restoring structural rigidity to the system, they can also control resonance effects, given the vibration periods of the virtually rehabilitated structure and the ground.
Drift ratio decreased when springs were considered at the base. This is because the foundation tends to rotate, and these rotations absorb part of the inertial forces of the superstructure, which begins to function similarly to a rigid block, thereby reducing drift ratio.
9. ACKNOWLEDGEMENTS
We would like to thank the Instituto Politécnico Nacional (IPN) as part of this text is derived from research projects carried out by the Secretaría de Investigación y Posgrado (SIP), for example: from the projects: 20211375 Structural Analysis of Buildings with Deficiencies in their Form-Load Relationship on Soft Soils in Mexico City, 20220309 Structural Systems with Inelastic Displacements.
10. REFERENCES
ASTM (2018), ASTM D1586/1586M-18 - Standard Test Method for Standard Penetration Test (SPT) and Split-Barrel Sampling of Soils, pp 3-12.
ASTM (2016), ASTM E8/E8M-16a - Métodos de Ensayo Estándar para Ensayos de Tensión de Materiales Metálicos, ASTM International, 2016".
Camargo, J. (2012), “Procedimiento para automatización de metodologías de identificación de sistemas en el análisis de edificios instrumentados”. Ciencia Nueva. http://132.248.10.225:8080/xmlui/handle/123456789/98, pp. 11-12.
Camargo, J. (2013), “Procedimiento para automatización de metodologías de identificación de sistemas en el análisis de edificios instrumentados”. Tesis doctoral. Universidad Nacional Autónoma de México. pp. 11-12.
CENAPRED (2018), “Espectros de respuesta en la Cdmx de los sismos de septiembre de 2017, M 8.2 en el Golfo de Tehuantepec y M 7.1 Puebla- Morelos”, Centro Nacional de Prevención de Desastres. México, p. 10.
CFE (2015), “Manual de Diseño de Obras Civiles”, Sección C: Estructuras, Tema 1: Criterios Generales de Análisis y Diseño, Capítulo C.1.3 Diseño por Sismo, Comisión Federal de Electricidad, p. 25
Chopra, A. (2014), “Dinámica de estructuras”, cuarta edición. Pearson Educación. México, p. 9.
De Buen López, O. (2004), “Diseño de Estructuras de Acero Construcción Compuesta”. Fundación ICA, Sociedad Mexicana de Ingeniería Estructural, A.C., pp. 12-14.
Gere, J., Goodno, B. (2016), “Mecánica de Materiales”, Octava edición. Cengage Learning. México, pp. 508 y 509.
Lermo, J., y Chávez-García, F. (1993), “Site effect evaluation using spectral ratios with only one station”. Bulletin of the seismological society of America, 83(5), pp. 1574-1594.
McCormac, J., Csernak, S. (2013), “Diseño de Estructuras de Acero”, quinta edición. Alfaomega. México, pp. 562-564.
Muriá, D. (2007), “Experiencia mexicana sobre la respuesta sísmica de edificios Instrumentados”. México DF: Academia de Ingeniería. México, p. 15-20.
Nakamura, Y. (1989), “A method For Dynamics Charateristics Estimation of Surface Using Microtremor On The Ground Surface”, Quarterly Report of Railway Tech Res. Inst. 30, pp. 25-33.
NTC-Cimentación (2023), “Norma Técnica Complementaria para Diseño y Construcción de Cimentaciones”, pp. 15-31.
NTC-Concreto (2023), “Norma Técnica Complementaria para el Diseño y Construcción de Estructuras de Concreto”, p. 29, 52.
NTC-Sismo (2023), “Norma Técnica Complementaria para el Diseño por Sismo”, pp. 18-30.
NTC- Rehabilitación Estructural (2023). “Norma Técnica Complementaria para la Evaluación y Rehabilitación estructural de edificios existentes”, p. 57-60.
ONNCE (2009), NMX-C-169-ONNCCE-2009. “Industria de la Construcción – Concreto - Extracción de especímenes cilíndricos o prismáticos de concreto hidráulico endurecido”
ONNCE (2013), NMX-C-109-ONNCCE-2013. “Industria de la Construcción – Concreto – Cabeceo de Especímenes”
ONNCE 128 (2013), NMX-C-128-ONNCCE-2013Industria de la Construcción – Concreto sometido a compresión - Determinación del Módulo de Elasticidad estático y relación de Poisson.
ONNCE (2014), NMX-C-083-ONNCCE-2014. “Industria de la Construcción – Concreto - Determinación de la resistencia a la Compresión de Especímenes-Método de Ensayo”, pp. 3-9.
ONNCE (2018), NMX-C-192-ONNCCE-2018. “Industria de la Construcción – Concreto – Determinación del Número de Rebote Utilizando el Dispositivo Conocido como Esclerómetro – Método de Ensayo”
RSCDMX (2023), “Servicio Sismológico Nacional”. Red Sísmica de la Ciudad de México. http://siscdmx.ssn.unam.mx/red-instrumentos/mapa-ubicacion/ . Ultimo acceso mayo de 2025.
Salmon, C., Johnson, J. (1996), “Steel Structures Design and Behavior”, cuarta edición. Prentice Hall. United States of America, pp. 957 y 958.
SAP2000v23 (2017), “CSI Structural Analysis and Design”, Editorial Computers & Structures, Inc., p. 204.
Segui, W. (2000), “Diseño de estructuras de acero con LRFD”, segunda edición. Thomson Editores, p. 451-455.
Torres, C. (2009), “Pruebas de vibración ambiental para determinar las propiedades dinámicas de un edificio de 23 niveles y los efectos interacción suelo-estructura”. Tesis de maestría. Instituto Politécnico Nacional, pp 7-10.