![]()
| Study Case | https://doi.org/10.21041/ra.v15i2.811 |
Resilience-based design of a tall building. Case-study
Diseño de un edificio alto basado en la resiliencia. Caso de estudio
Projeto de um edifício alto baseado na resiliência. Estudo de caso
Aung T. H.1, Ali Talpur M. S.2
1 Executive Director, AIT Solutions, Asian Institute of Technology, Thailand.
2 Coordinator, Civil & Structural Engineering Unit, AIT Solutions, Asian Institute of Technology, Thailand.
*Contact author: aung.aits@ait.asia
Received: 08/09/2023
Revised: 17/10/2024
Accepted: 29/11/2024
Published: 01/01/2025
| Cite as: Aung, T. H., Ali Talpur, M. S. (2025), “Resilience-based design of a tall building. Case-study”, Revista ALCONPAT, 15 (2), pp. 188 – 204, DOI: https://doi.org/10.21041/ra.v15i2.811 |
Abstract
This paper presents the assessment of performance of a case-study tall building in quantitative manner in terms of structural and nonstructural components damage, repair cost and repair time, following methodology mentioned in FEMA P-58, precursor guidelines of resilience-based design. In the current practice of seismic design, safety is primarily considered to measure the performance of the structure. The recovery of the functionality of the structure, resilience, is not well addressed in the current design approaches. Although today’s performance-based seismic design approaches assess the structural performance of the buildings explicitly for different levels of earthquakes, post-earthquake functionality and consequences are not well evaluated in the design process. For extreme earthquake events, although the global and local responses of structural system of the buildings are generally checked to prevent the total or partial collapse of the building, the extent of damage to nonstructural components, building contents, repair time and cost and casualties are not specifically analyzed.
Keywords: resilience-based design, maximum considered earthquake, tall building.
NOMENCLATURE
| FEMA | Federal Emergency Management Agency, US Government |
| BRB | Buckling restrained brace |
| MCER | Risk-targeted Maximum Considered Earthquake |
| SLE | Service Level Earthquake |
| ETABS | Extended Three-dimensional Analysis of Building Systems |
| NLTHA | Nonlinear Time History Analysis |
1. INTRODUCTION
In the current practice of seismic design, safety is primarily considered to measure the performance of the structure. Current code-based standards are primarily focused on life safety performance level and a lack of consideration of functionality of non-structural components, disruptions and slow recovery after a major earthquake event. The costs associated with the loss of use of a building during repair can be larger than the value of the building itself. Resilience-based design approach can quantify the risk of making personalized risk decisions for developers, architects, engineers and other design professionals to reduce the uncertainty and downtime, and future financial losses.
In this study, the process of resilience-based design approach is presented for a 63-story tall building, located in a high seismic zone, as shown in Figure 1. There are three tall residential buildings in the same development resting on a two-story common podium. The case study building is approximately 197.3 meters tall above the ground level with 4-story of below grade parking (extending approximately 13 m below grade). The tower consists mainly of residential units, and a terrace and amenity deck. The ground level contains retail and back of the house space. In this study, resilience-based design was conducted, focusing on the tower portion of the building.
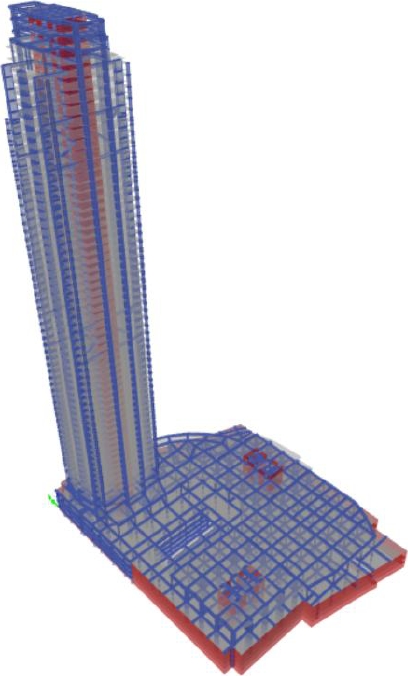
Figure 1. 3D view of the case-study building.
2. STRUCTURAL SYSTEM
In case-study building, gravity loads are primarily resisted by the post-tensioned flat slab system at the tower floor levels. Lateral forces are mainly resisted by the reinforced concrete core built around the elevator shaft, stair cores and other services. Two outrigger zones are provided at 27th – 31st floor and 50th – 54th floor along the weak axis of the core. Buckling restrained braces (BRBs) are used in the outrigger system to couple the core and the outrigger columns. Structural system of the building is shown in Figure 2. Mat foundation with 3 m – 4 m thickness is used under the tower to support the structure.
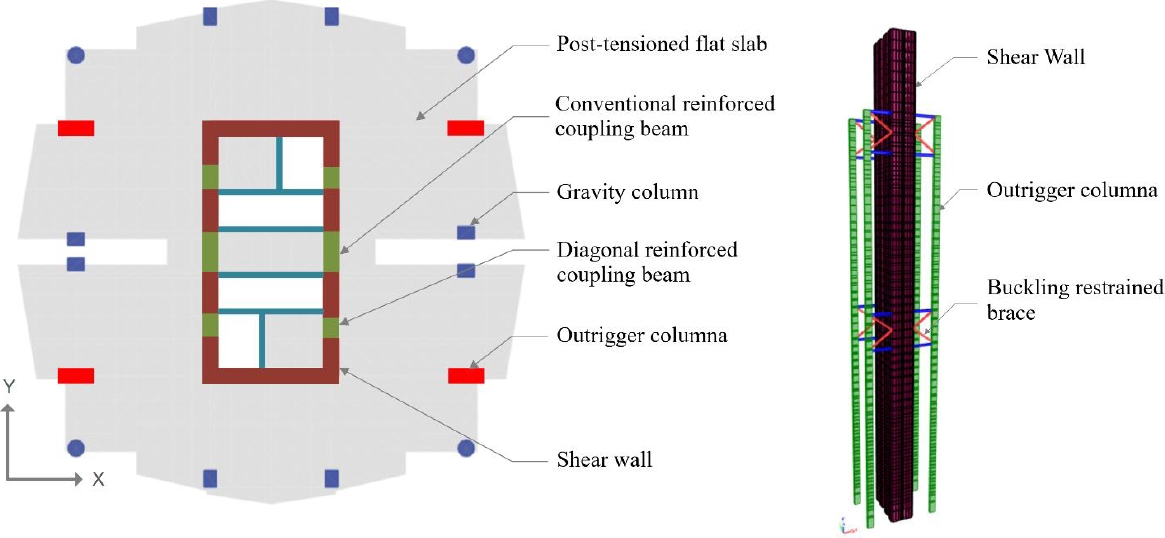
Figure 2. Structural system in plan view and 3D view.
3. METHODOLOGY
Firstly, the building was designed by performance-based seismic design approaches, primarily focusing on structural performance under wind, Service Level Earthquake (SLE) and risk-targeted Maximum Considered Earthquake (MCER). Seismic input was obtained from site-specific probabilistic seismic hazard assessment. Response spectra of SLE and MCER are shown in Figure 3. SLE earthquake has a return period of 43 years with 50% probability of exceedance in 50 years and MCER earthquake has return period of 2475 years with 2% probability of exceedance in 50-years. Under SLE earthquake (43-year return period), the structure was designed to remain essentially elastic with minor yielding of structural elements. Under MCER earthquake, the structure was evaluated at Collapse Prevention performance level with a low probability of collapse in which extensive structural damage may occur, repairs to structural and nonstructural components may or may not be economically feasible. A suite of 11 horizontal ground motion pairs, which were selected and modified to match the MCER target spectrum, was used in the nonlinear time history analysis. The evaluated performance levels qualitatively describe the severity of damage of building; however, they are not quantitively in terms that are meaningful to the decision-makers.
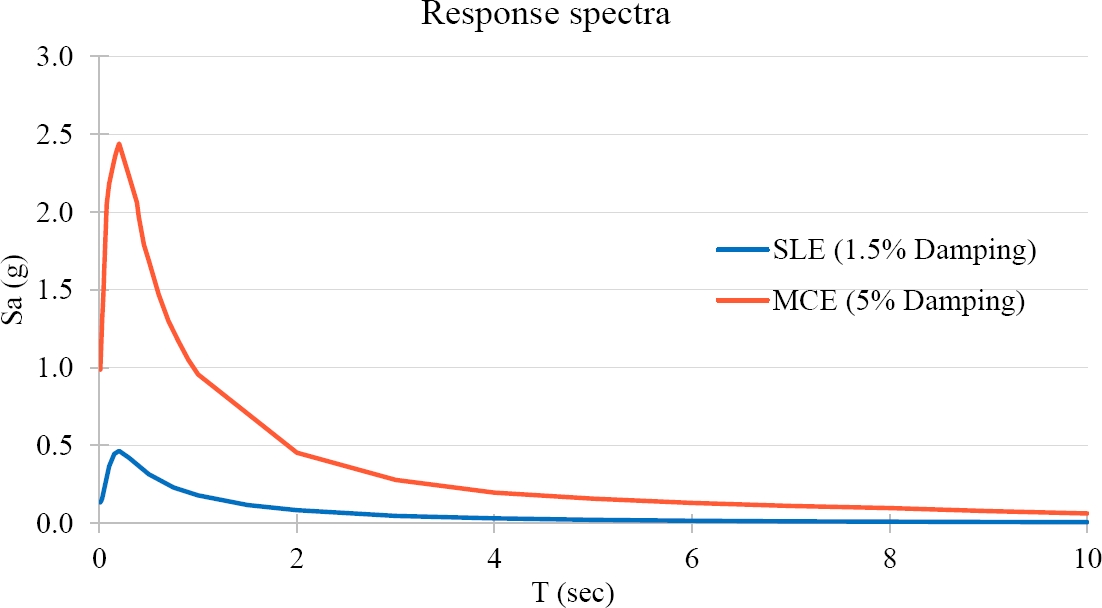
Figure 3. Response spectra.
In this resilience-based assessment, intensity-based assessment was carried out to evaluate the probable performance of the building, subjected to a specified earthquake shaking intensity (FEMA P-58). The building performance was assessed under MCER earthquake, using metrics that are more directly usable and important to stakeholders, including repair cost, repair time of structural and nonstructural components. Structural design output from performance-based seismic design was used for the analysis and assessment. Global and local responses of structural system from nonlinear time history analysis results of 11 horizontal ground motion pairs are used as basis to evaluate the damage, repair cost and repair time of other components. To consider the uncertainties of the earthquake impact and consequences, a larger number of simulated demand sets (realizations) are generated to compute the reliable outcome. Each realization represents one possible outcome. In this study, 200 demand sets were generated by Monte Carlo simulation in which the demands from 11 ground motions were mathematically transformed into 200 simulated demand sets. Using deformation of members, drifts and acceleration demand sets of 200 ground motions, damage of structural and nonstructural components was assessed. Corresponding damage extent of the component was determined by predefined fragility curves (cumulative distribution function curves) which correlates the damage probability and the drift or acceleration demand. Repair cost and repair time were estimated based on the extent of damage.
In this case study, damage of coupling beams, shear walls, post-tensioned slabs, curtain walls, gypsum partition walls, ceiling, steel pipes, HVAC system and fire sprinkler system was assessed.
4. MODELING PROCEDURE
4.1 Elastic Model
Complete, three-dimensional elastic computer models of the studied tower and entire podium were created using ETABS to investigate the overall behavior and response of the structure under wind and SLE earthquake. Nominal material properties are used in wind analysis model for strength design while expected material properties are used in SLE model and wind serviceability check. Walls and slabs are modeled using shell elements. Columns, coupling beams, BRBs and beams are modeled using frame elements.
4.2 Nonlinear Model
A complete, three-dimensional nonlinear model of the studied tower and entire podium was created in Perform3D. The model includes inelastic member properties for elements that were anticipated to be loaded beyond their elastic limits. These include flexural response of beams, columns, shear walls and coupling beams and axial response of BRBs. Elements that are assumed to remain elastic are modeled with elastic member properties. These include the shear response of walls, beams, and columns, diaphragm slabs, and basement walls.
Shear walls are modeled using Perform3D shear wall element. Nonlinear fiber elements were used to model the nonlinear in-plane flexural behavior of shear walls. Unconfined concrete, confined concrete and vertical reinforcement of the shear walls were discretized as fibers in the wall element. Material stress-strain curves of those materials were considered for nonlinear in-plane flexural behavior. Out-of-plane bending, and shear behavior of the walls were modeled as linear.
Conventional-reinforced concrete coupling beams were modeled with moment hinges at the ends of the beam. Moment-rotation backbone curves were defined based on ASCE 41-17. The yielding moment capacity of the hinges were calculated based on the longitudinal reinforcement provided at the ends of the beams. Diagonal reinforced concrete coupling beams were modeled with shear hinges at the mid span of the beam. The shear area of the beam section was set to zero, considering that there is no shear deformation along the length of the beam. The yielding capacity of the shear-displacement type hinges was calculated based on the diagonal reinforcement provided in the beams. PERFORM3D “BRB compound component” was used to model the BRBs. PMM response of columns was modeled with fiber hinges at the ends of columns.
5. MCER EVALUATION RESULTS
5.1 Modal Analysis Results
Natural periods of the building are shown in Table 1. The first mode is translation in X-direction, the second mode is translation in Y-direction and the third mode is in torsion.
Table 1. Modal analysis results.
| Mode | Natural period (sec) | Mass participation in X-dir. (%) | Mass participation in Y-dir. (%) |
| 1 | 7.42 | 59% | |
| 2 | 6.06 | 61% | |
| 3 | 4.64 |
5.2 Base Shear
The base shear of tower above the podium level is summarized in Table 2 for elastic base shear from MCER response spectrum analysis and average nonlinear base shear from nonlinear time history analysis of 11 MCER earthquake ground motions. The seismic weight of the tower above the podium level is 736,800 kN.
Table 2. Base shear above podium level
| Base shear in X-dir. | Base shear in Y-dir. | |
| MCER (Elastic) | 106,880 kN (14.5% of seismic weight) | 102,740 kN (13.9% of seismic weight) |
| MCER (NLTHA) | 59,046 kN (8.0% of seismic weight) | 40,523 kN (5.5% of seismic weight) |
5.3 Story Drift
Transient drift (in Figure 4) and residual drift (in Figure 5) of 11 ground motions along the height of the tower were checked. Residual drifts were checked to protect against excessive post-earthquake deformations. The drifts are generally within the limits of “Collapse Prevention” performance level.
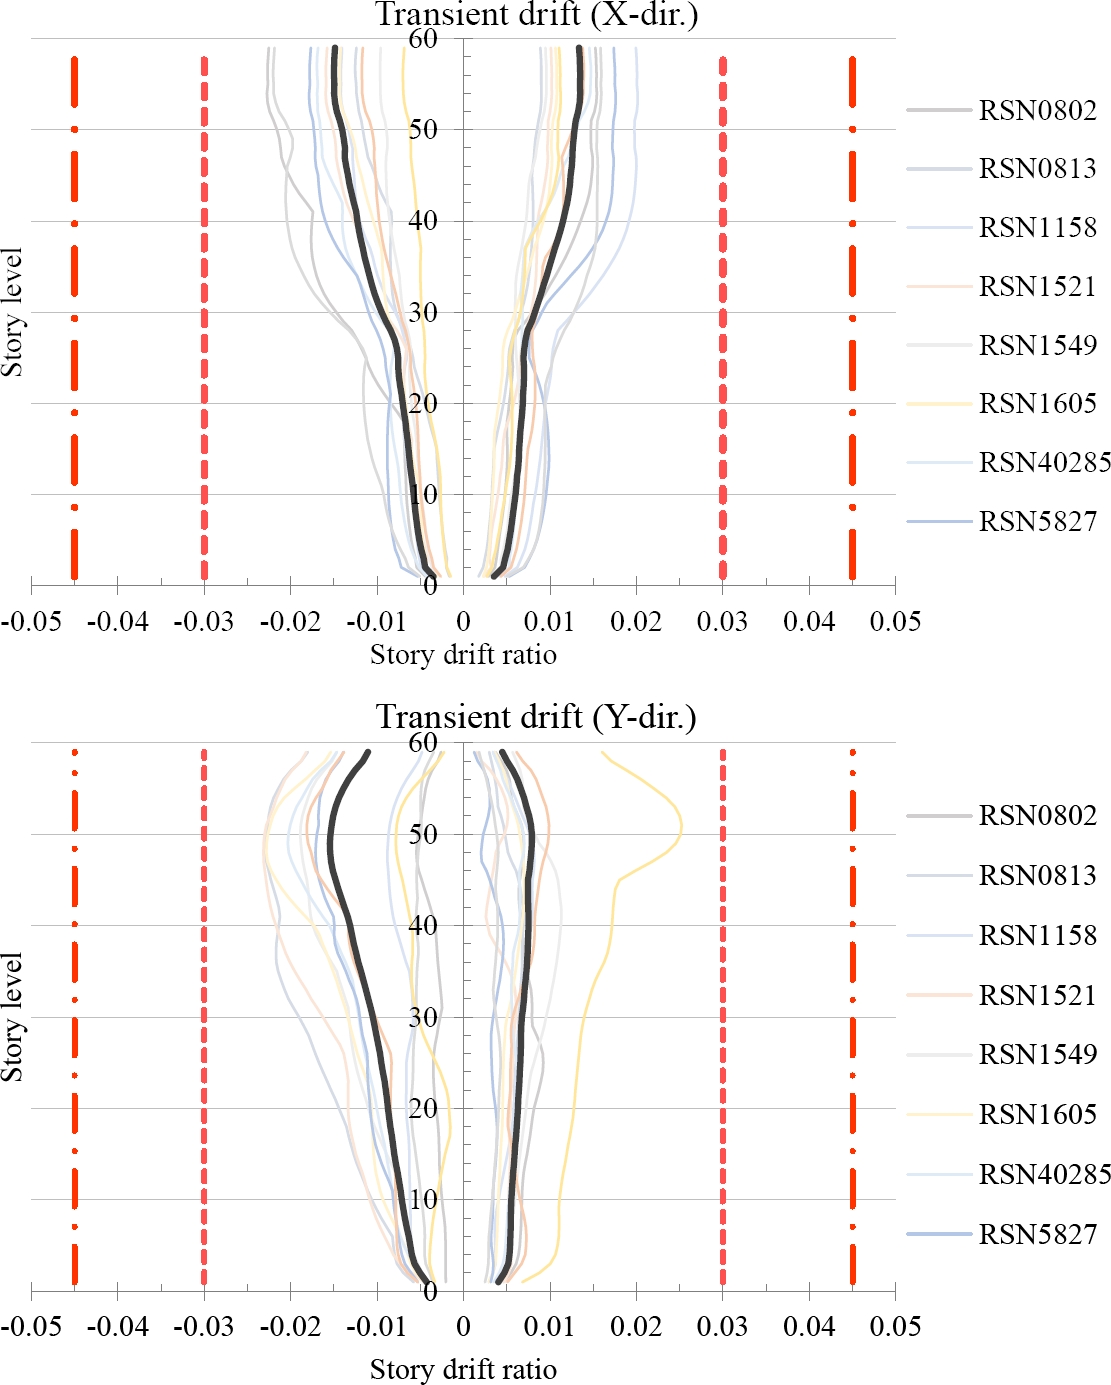
Figure 4. Transient drifts in X and Y directions.
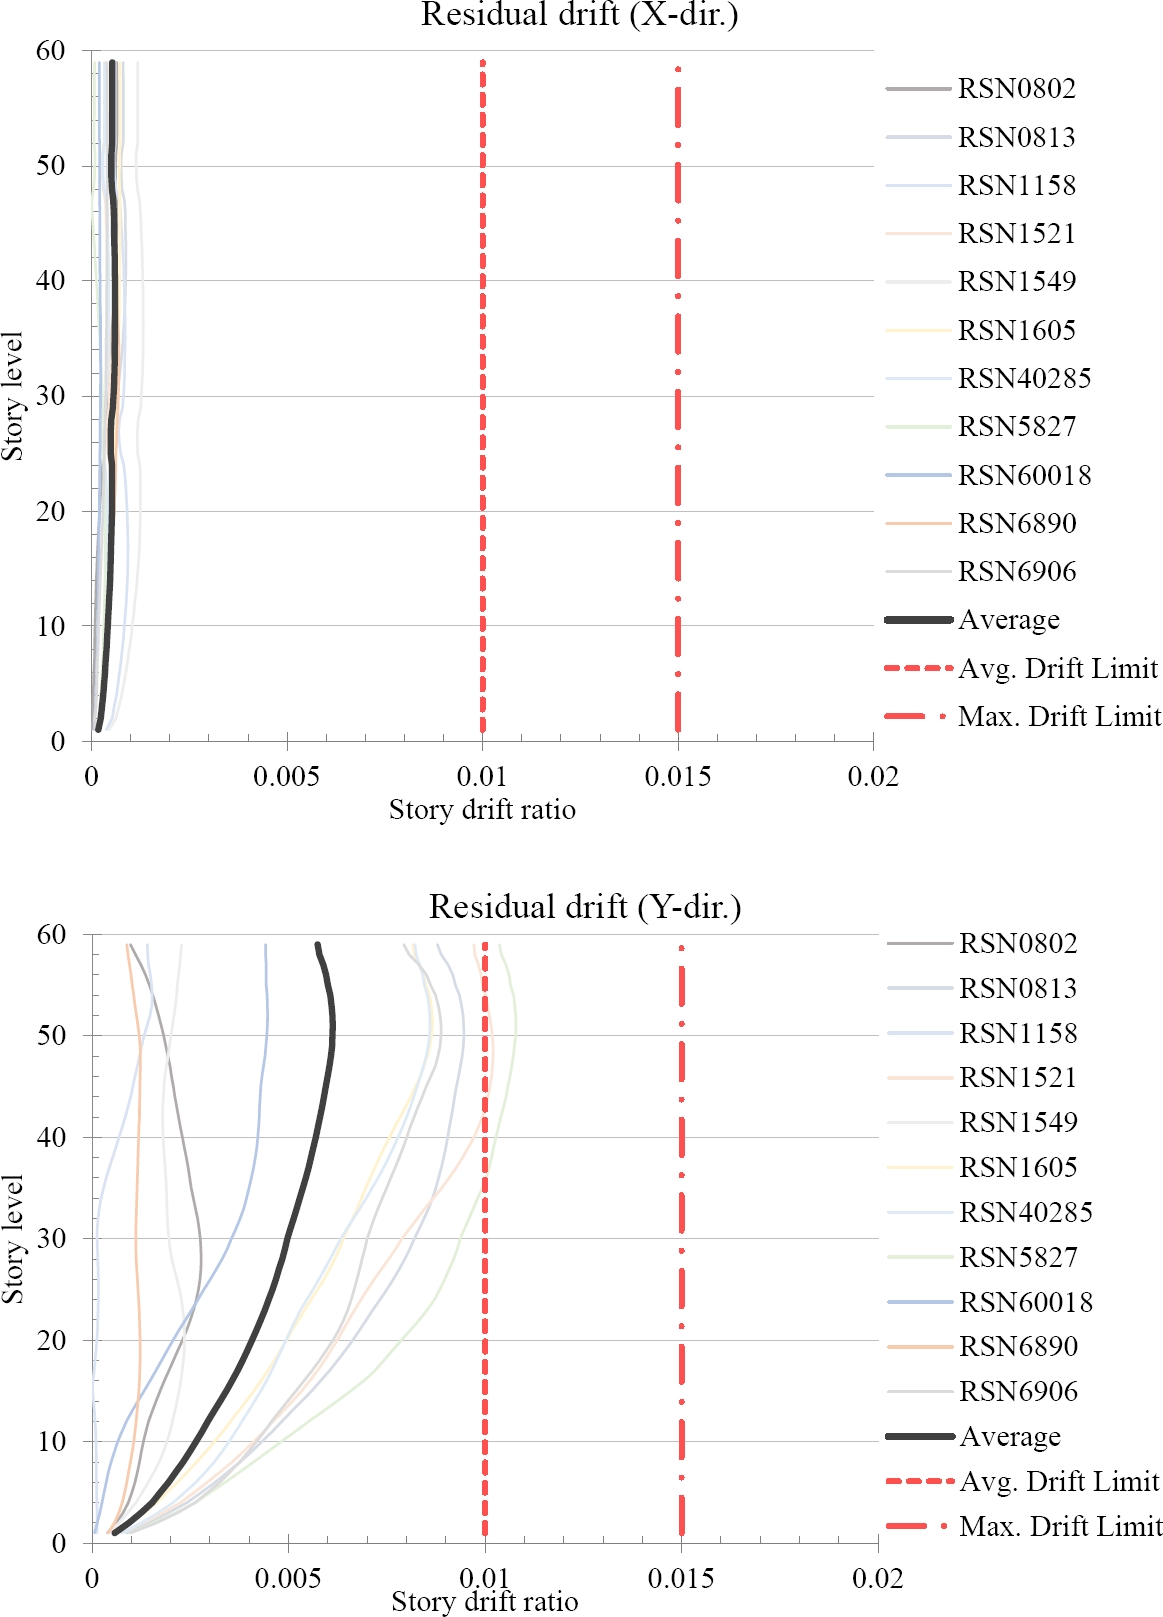
Figure 5. Residual drifts in X and Y directions.
5.4 Story Acceleration
Absolute story acceleration of 11 ground motions along the height of the tower is plotted in Figure 6. Generally, story acceleration is 0.5 – 0.6 g in tower portion.
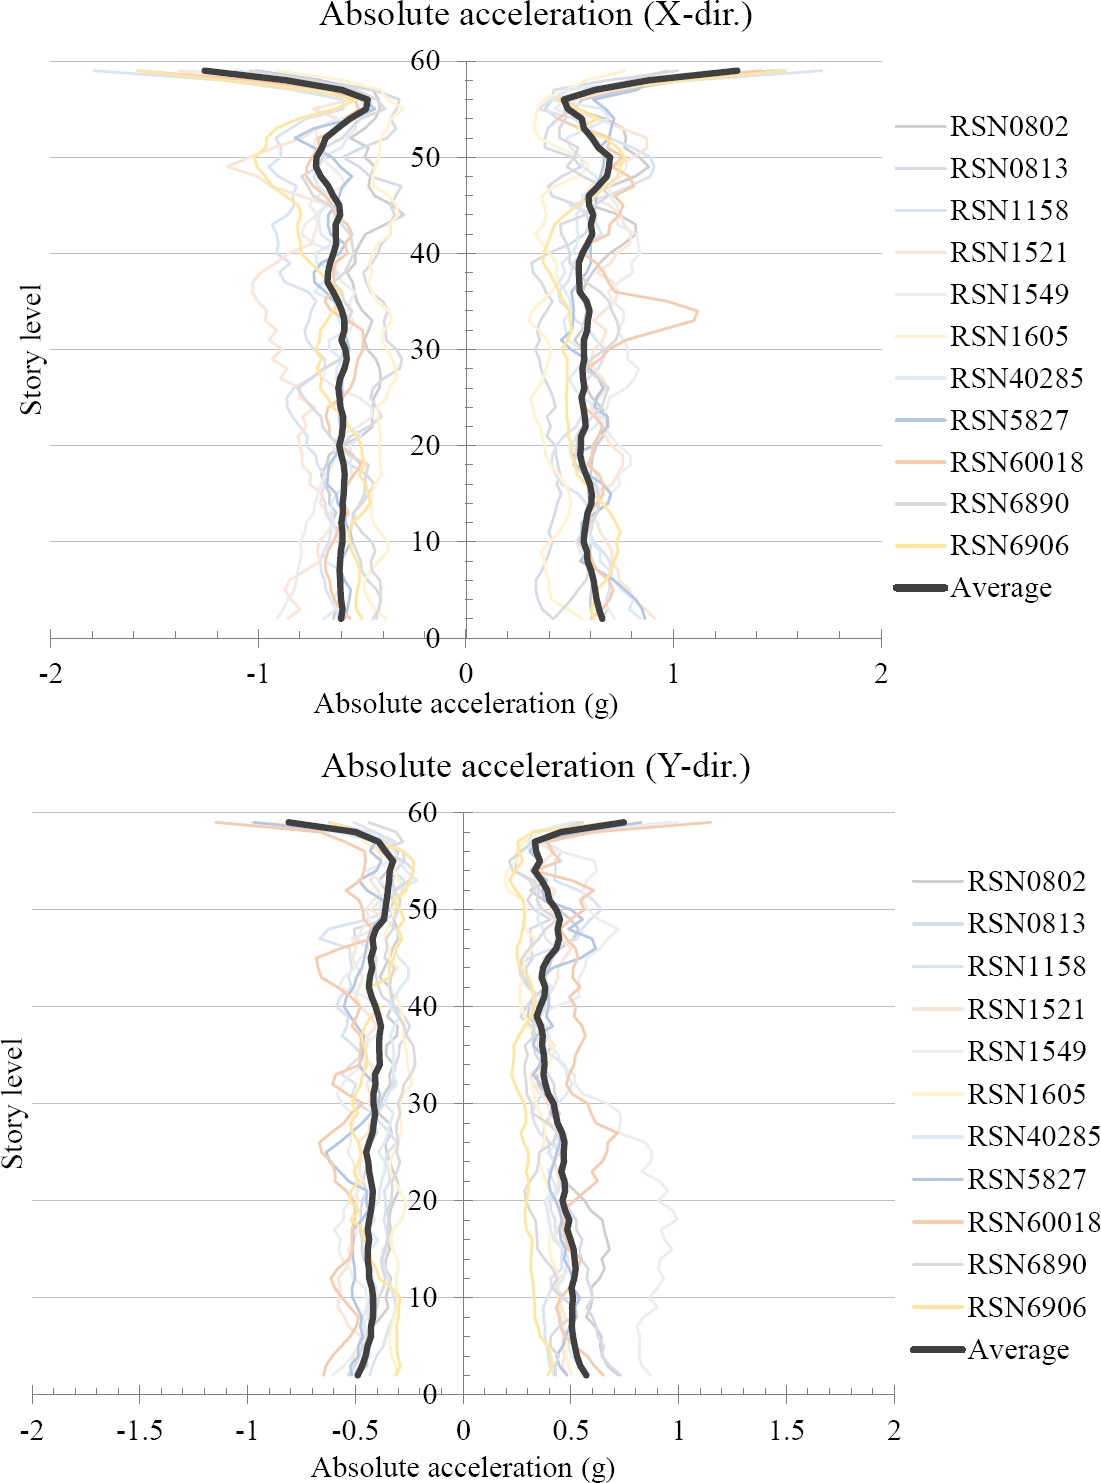
Figure 6. Absolute acceleration in X and Y directions.
5.5 Shear Walls
Axial strains of concrete and rebar fibers were checked for the flexural response of shear walls from 11 ground motion analysis results. Concrete compressive strains are lower than the crushing strain limit of 0.003 and rebar strains are generally lower than yielding strain of 0.002, except for a few floors. Shear walls may yield in flexure at the base and near to the upper portion under extreme earthquakes. The shear demand of each shear wall leg was checked against the shear strength capacity of each leg. Figure 7 shows the axial strain of 11 ground motions and average strain at one corner of shear wall along the height.
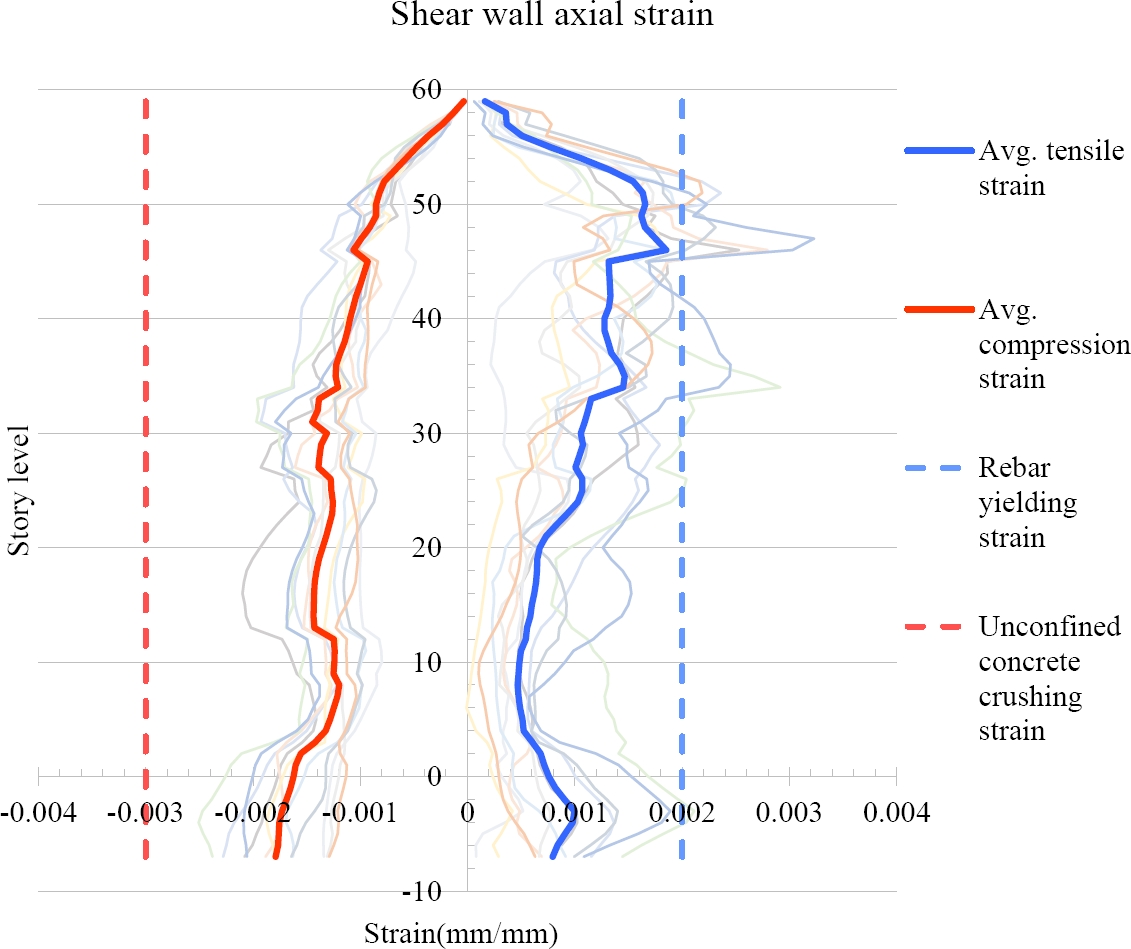
Figure 7. Shear wall axial strain.
5.6 Coupling Beams
Rotation of coupling beams were checked along the height of the tower. Inelastic rotations of coupling beams are generally within the limits of “Collapse Prevention” performance level. For shear strength requirement of conventional reinforced coupling beams, probable shear demand based on moment capacity of the beam was checked with the shear capacity. Figure 8 shows the rotation of one coupling beam for 11 ground motions and average rotation along the height. Figure 9 shows the location of coupling beam and corner of shear wall where axial strain is checked.
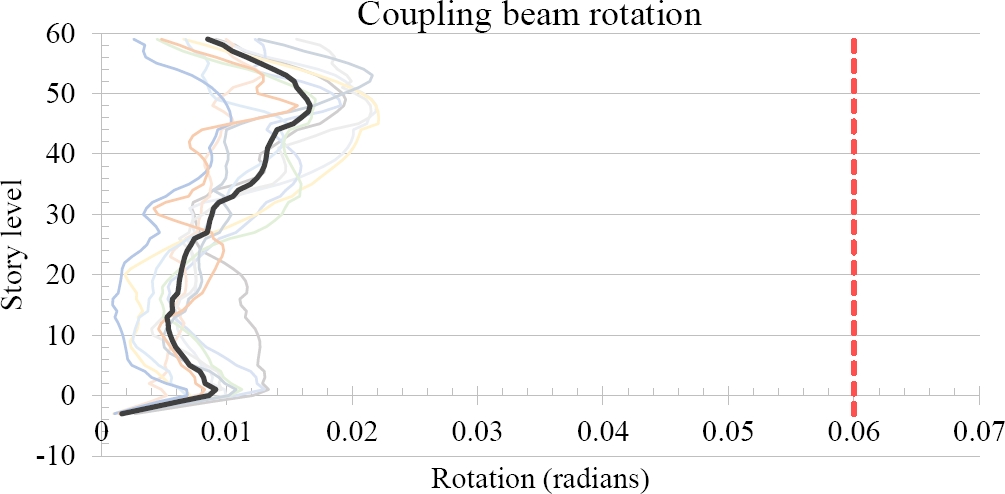
Figure 8. Diagonal reinforced coupling beam rotation
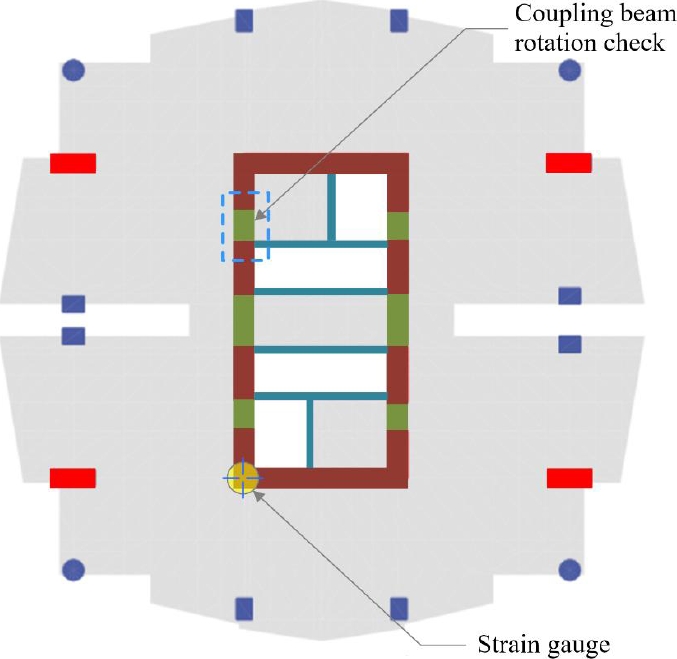
Figure 9. Locations of sample results of shear wall axial strain and coupling beam rotation.
6. SIMULATED DEMAND SETS (REALIZATIONS)
For damage assessment, Performance Assessment Calculation Tool (PACT) was used. Results from 11 sets of ground motions were mathematically transformed into 200 simulated demand sets (realizations), instead of analyzing large number of ground motions. Realizations for rotation of coupling beams, transient drifts and story accelerations were generated to correlate the response quantities predicted in the nonlinear time history analysis and uncertainties inherent in structural response prediction. Figure 10 presents the realization of one coupling beam at Level 22, Figure 11 presents the realizations for transient drift of Level 27 and Figure 12 presents the realizations for acceleration of Level 37.
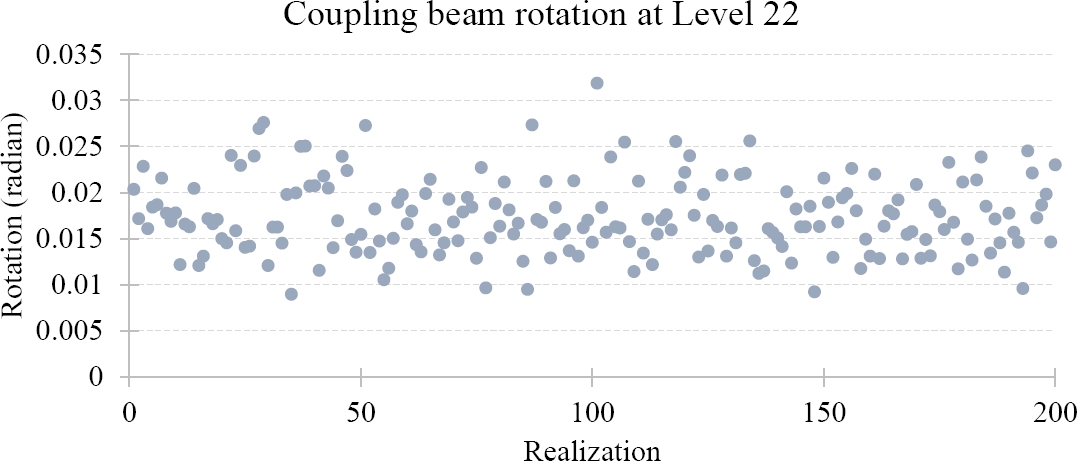
Figure 10. Simulated demand sets (realizations) of rotation of one coupling beam.
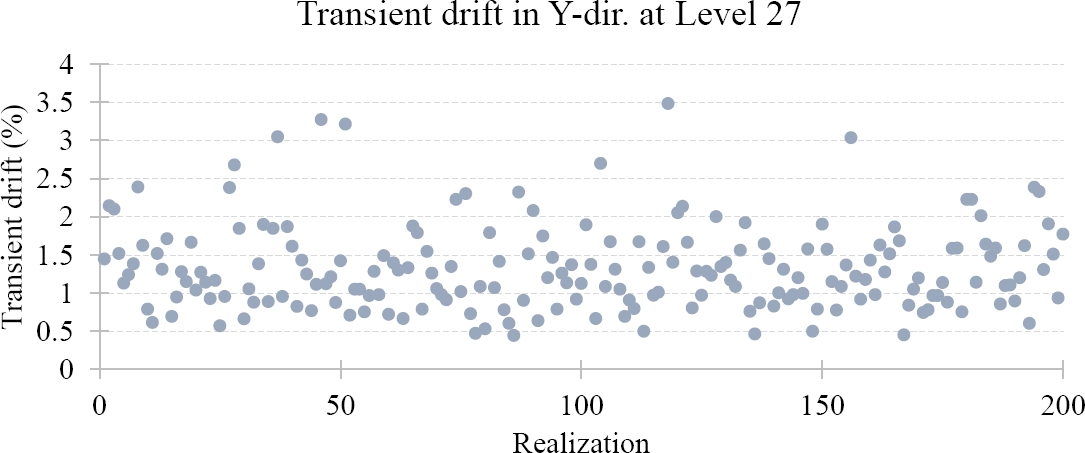
Figure 11. Simulated demand sets (realizations) of transient drift in Y-dir. at Level 27.
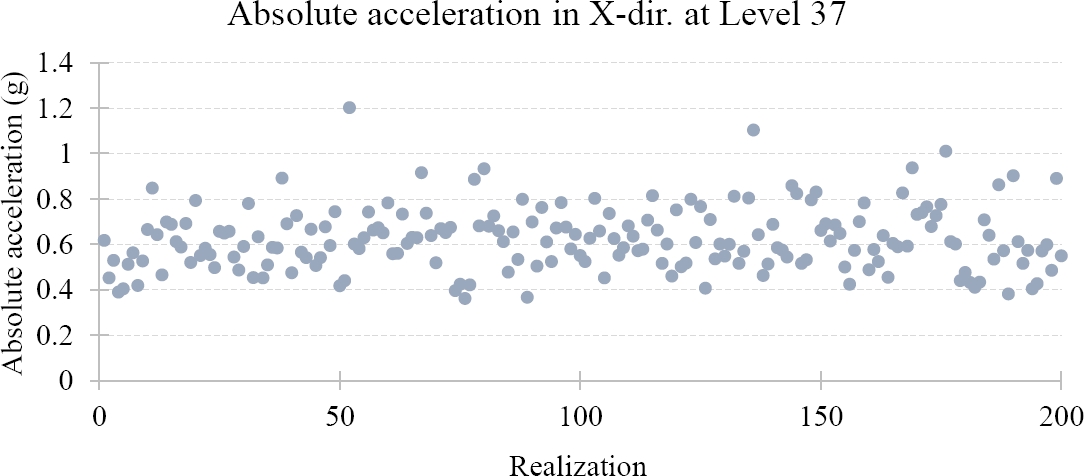
Figure 12. Simulated demand sets (realizations) of story acceleration in X-dir. at Level 37.
7. FRAGILITY CURVES OF COMPONENTS
Fragility functions are used to indicate the probability that a component will be damaged as a function of a single predictive demand parameter, such as story drift or floor acceleration. Fragility functions which were developed for damage state of interest of the component from a suitable series of tests documented from FEMA P-58 were used in this study. Sample fragility curves for shear wall (in Figure 13) and gypsum partition wall (in Figure 14) are shown in the following figures.
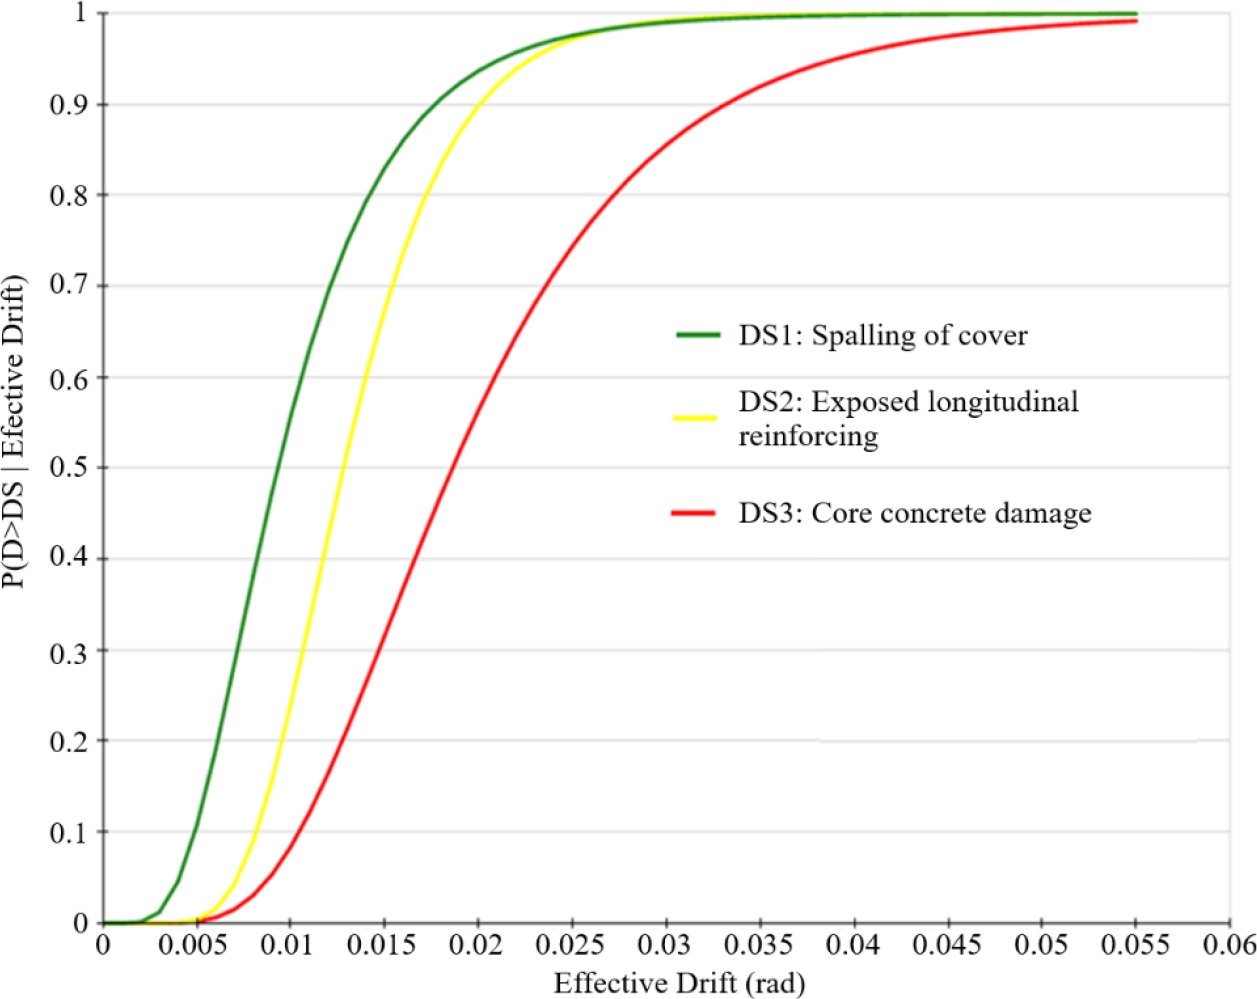
Figure 13. Fragility curve of shear wall.
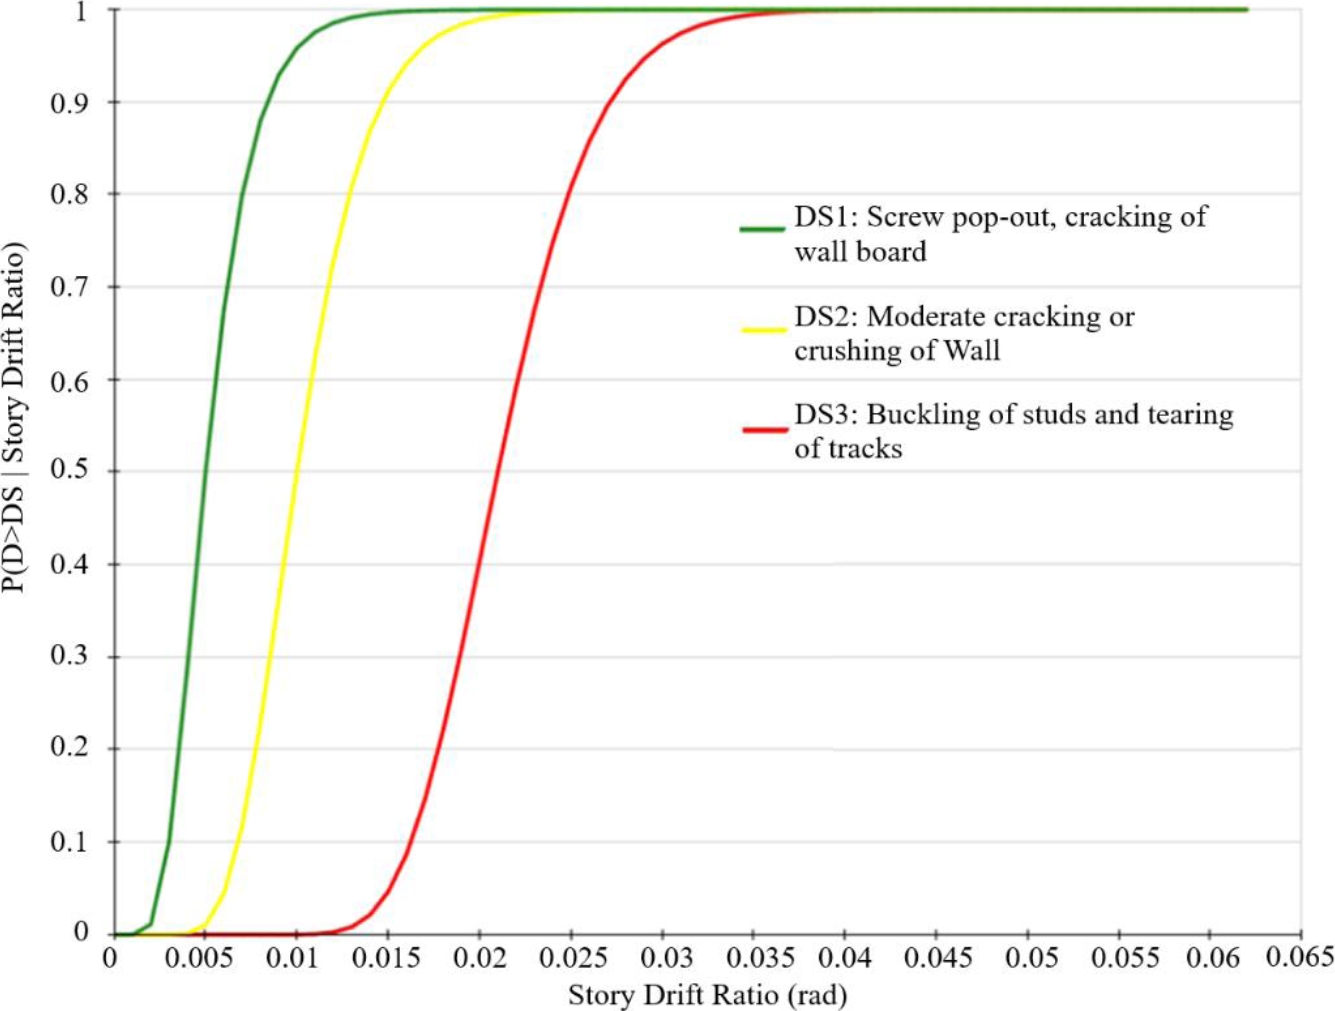
Figure 14. Fragility curve of gypsum partition wall
8. DAMAGE ASSESSMENT
Damage for each component was assessed for each realization using the corresponding fragility functions. First, the probability of each damage state of each realization of each component was checked from fragility function. Random number generation was used to select an integer between 1 and 100 and assign the damage state of each realization, considering the known probability of each damage state (FEMA P-58).
Figure 15 shows the sample calculation of damage state of one shear wall for one realization. In that realization, rotation of shear wall is 0.01 radian. Based on the fragility curve, probabilities of damage states are shown in Table 3. E.g. If the generated random number between 1 and 100 is 70, the damage state for that realization is Damage State 1.
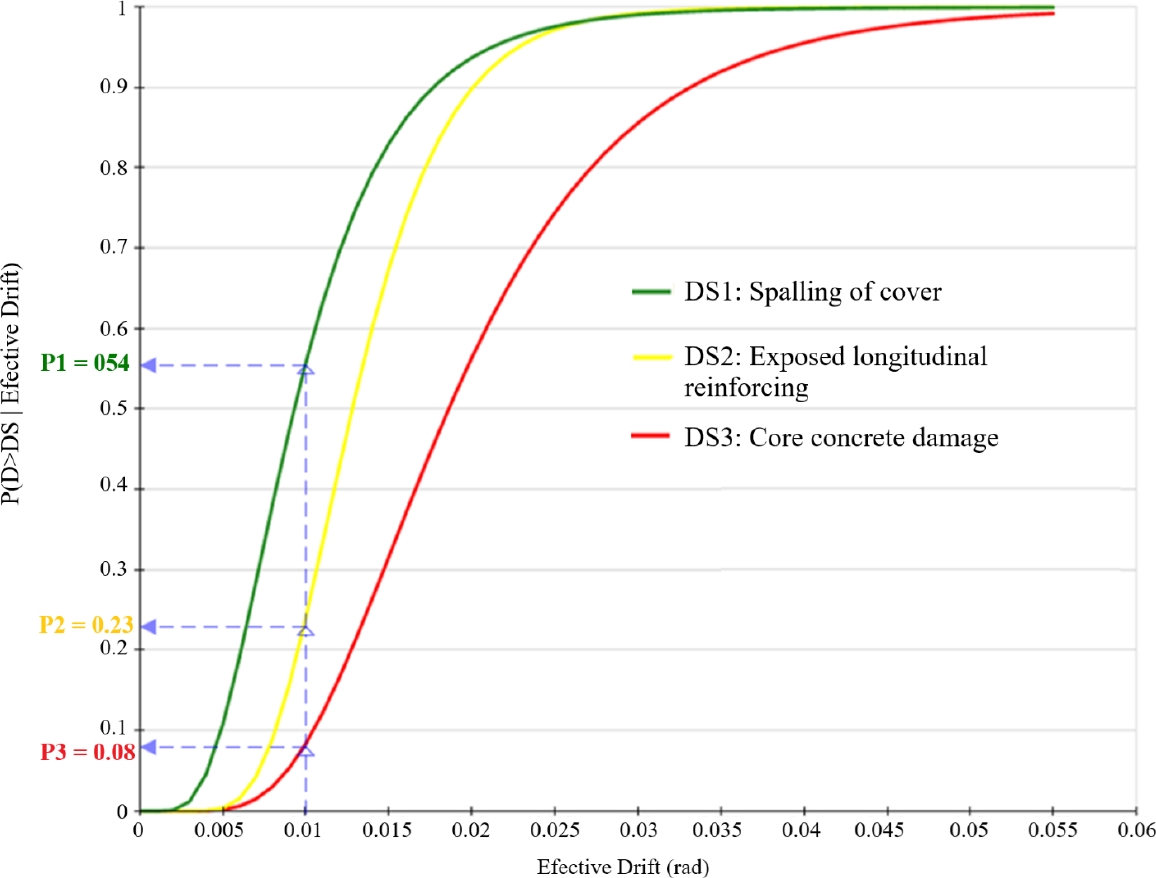
Figure 15. Damage state assessment of one realization of rotation of one shear wall.
Table 3. Probability of damage state for diagonal reinforced coupling beam.
| Probability of No Damage | Probability of Damage State 1 | Probability of Damage State 2 | Probability of Damage State 3 | |
| Occurring | 0.54 | 0.23 | 0.08 | |
| Not-occurring | 0.46 | 0.77 | 0.92 | |
| Range for random number | 1 – 46 | 47 – 77 | 78 – 92 | 93 - 100 |
9. REPAIR COST AND REPAIR TIME
In each realization, repair cost was calculated for each damaged component. Median repair cost of each component type was used. Cost per unit of repair in lower bound quantities and upper bound quantities were also considered. If a fewer quantity of components is damaged in realization, the median repair cost per unit will be higher than the median repair cost per unit of realization with larger number of components to be repaired (FEMA P-58).
Repair time was estimated by simply applying the labor factor to the baseline repair cost in which the labor cost is embedded. From the total labor cost, repair time was estimated with the labor rate. The number of days of repair time was estimated by dividing the labor hours determined for each realization by the number of workers that can be accommodated inside the building during repair.
Figure 16 shows the average repair cost of realization 80 and 98 with respect to the component type. Figure 17 presents the repair cost of each component type of each realization. Repair cost of realizations in which residual drift is beyond the limit was not calculated. Figure 18 presents the cumulative distribution function of probability of total repair cost with median value. Figure 19 shows repair time of each component type of each realization.
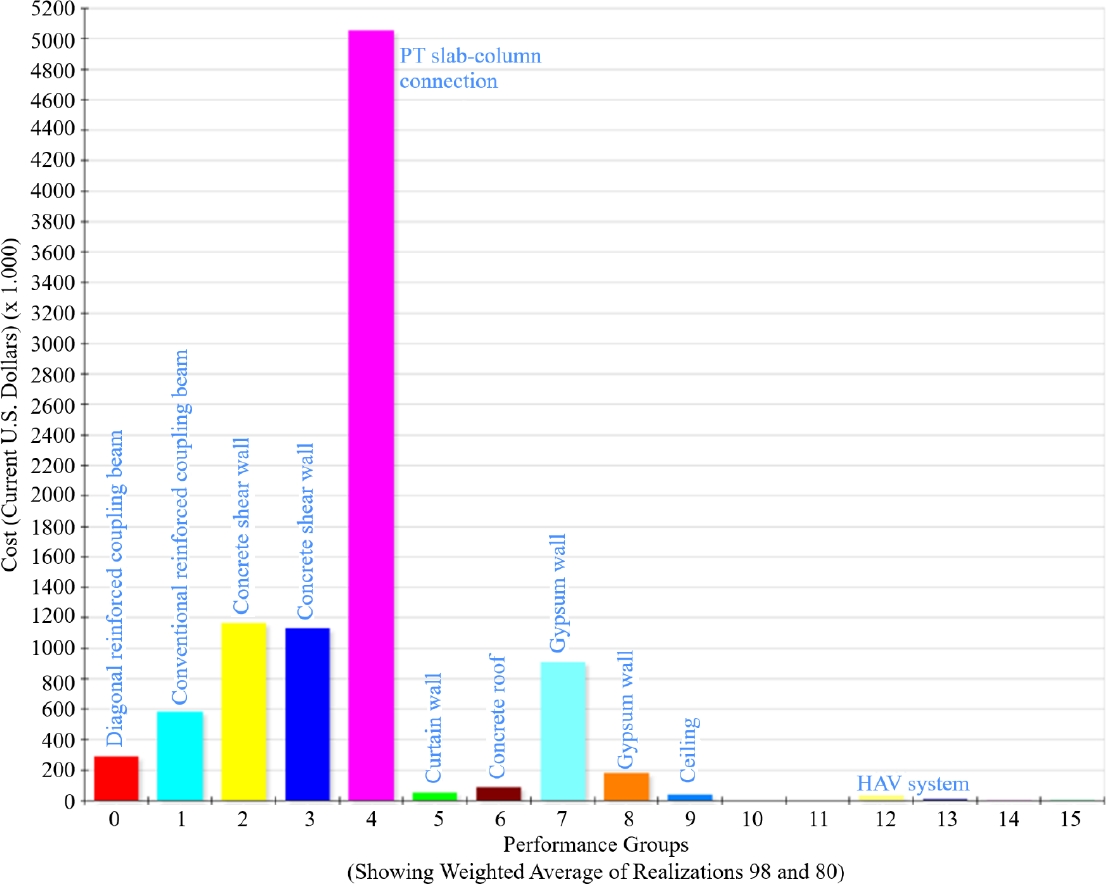
Figure 16. Repair cost of each component type for average realizations 80 and 98.
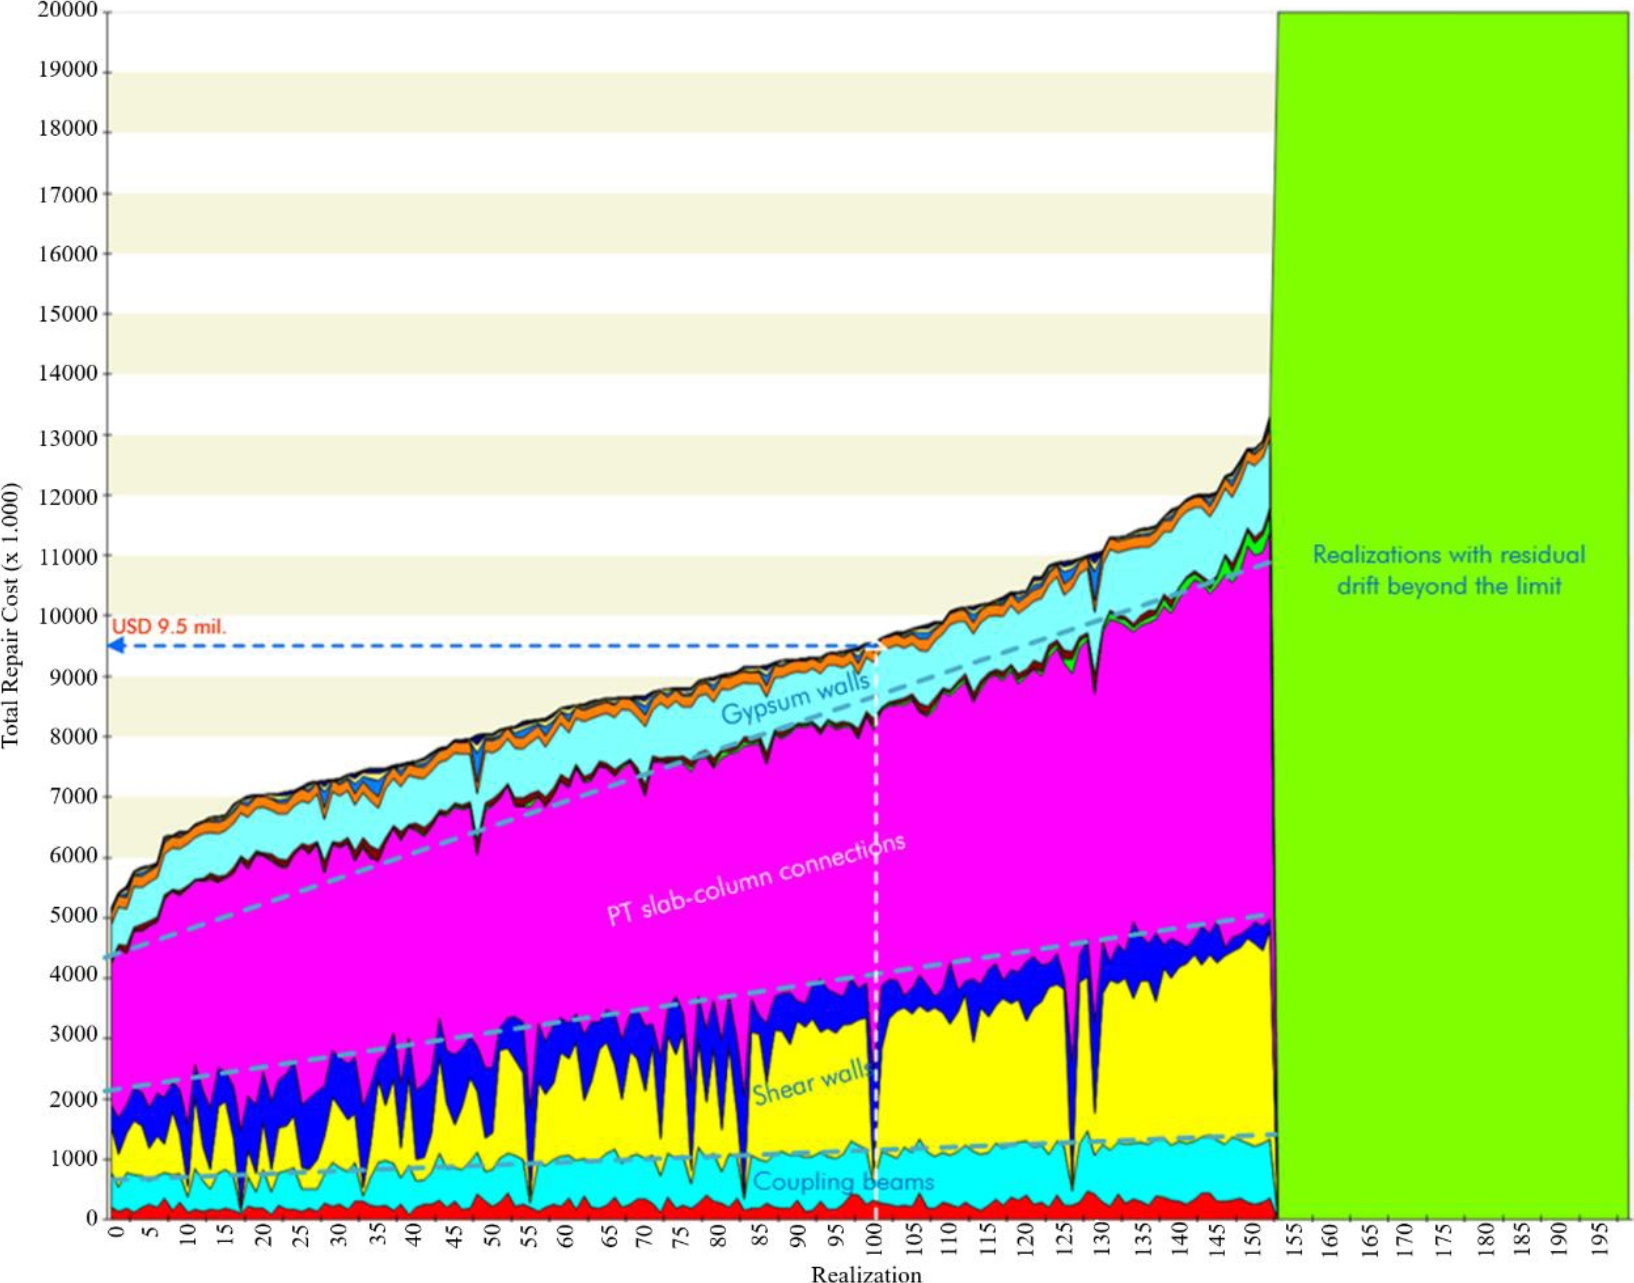
Figure 17. Repair cost of each component type for each realization.
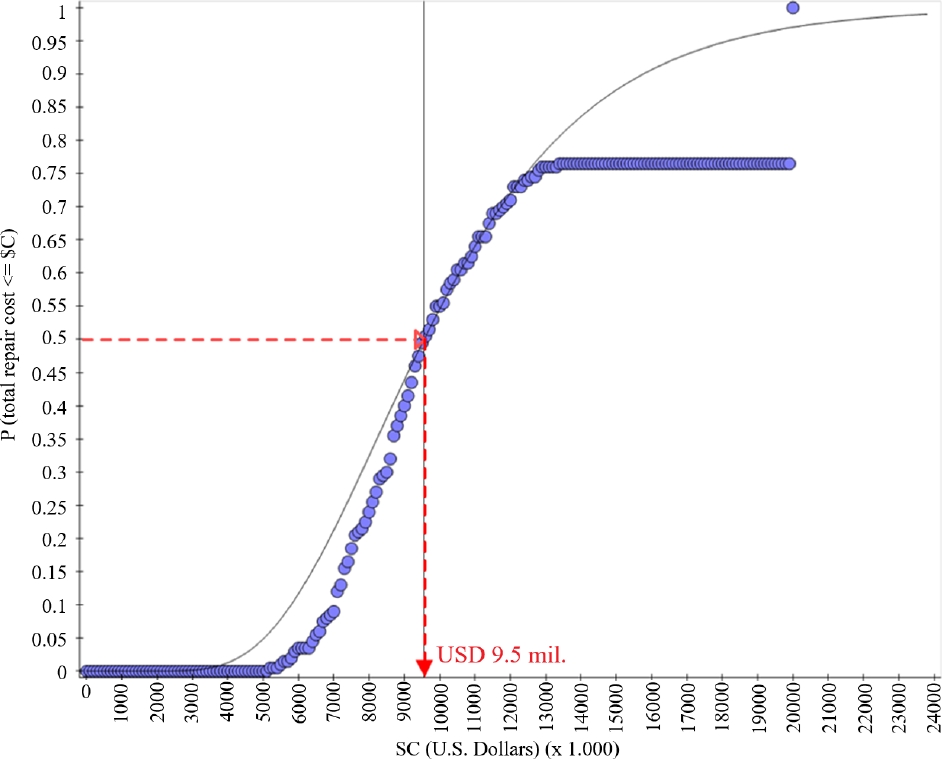
Figure 18. Probability of repair cost.
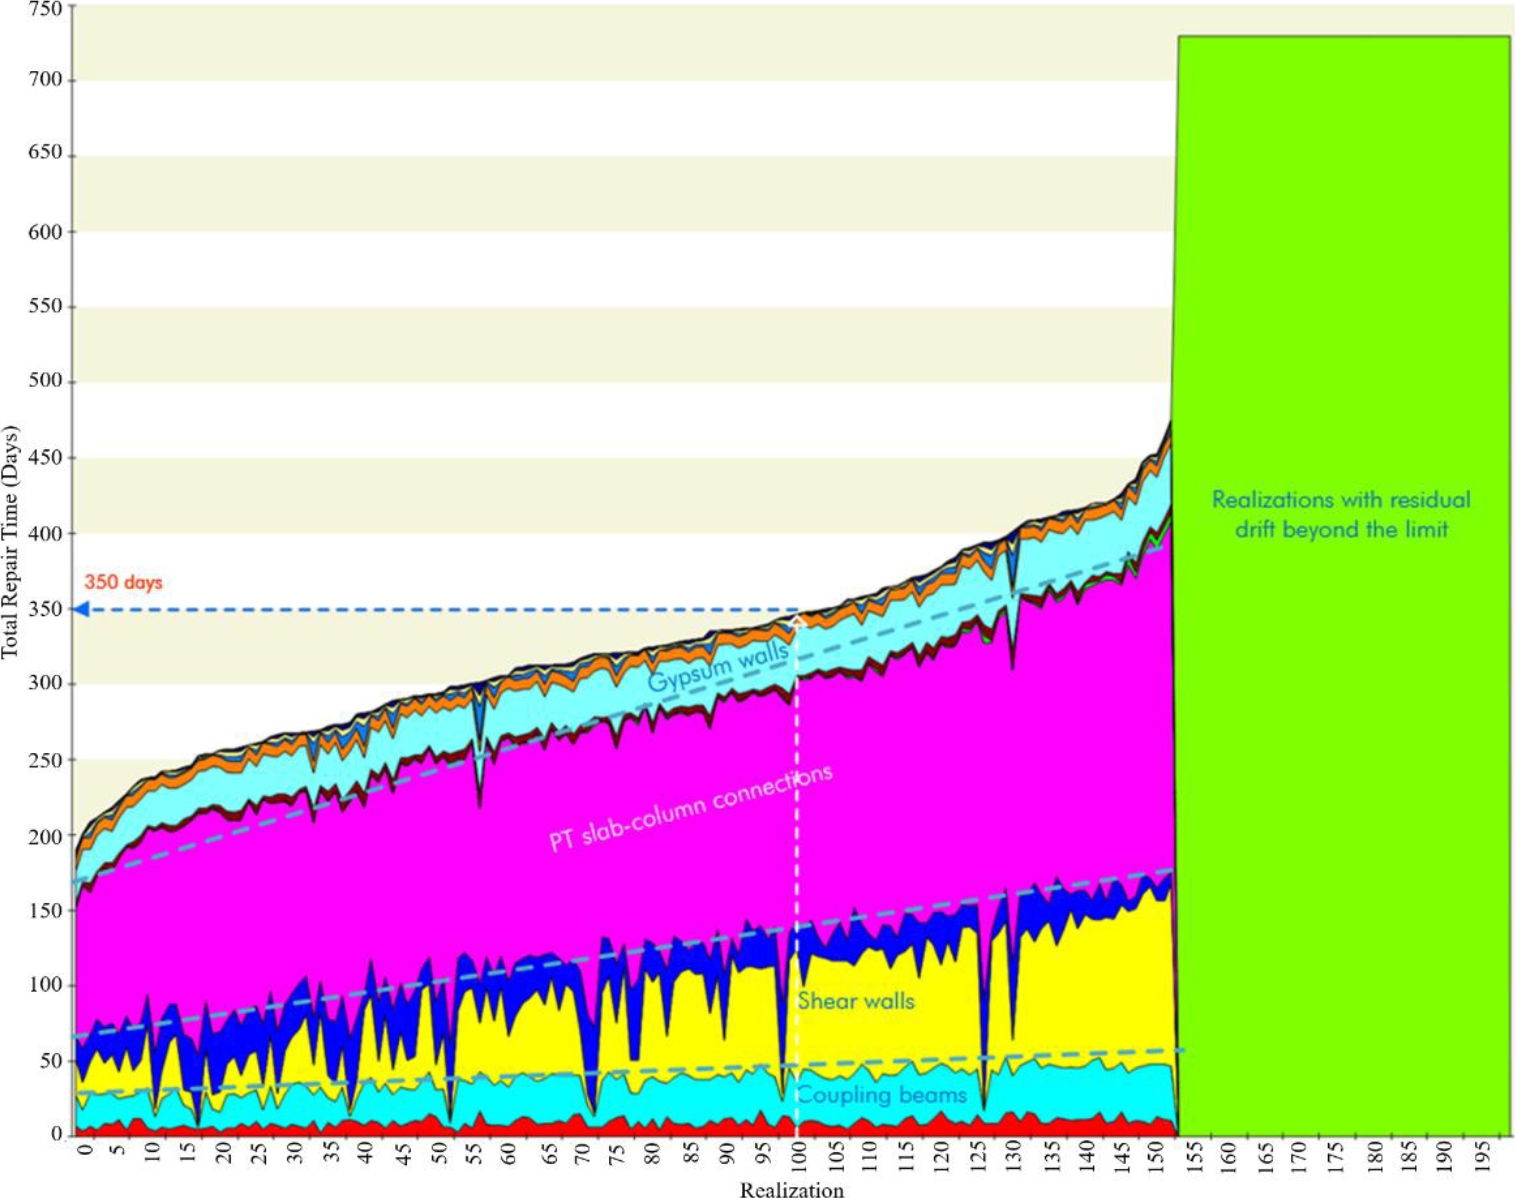
Figure 19. Repair time of each component type for each realization.
It was found that the approximate repair cost is USD 9.5 mil. (median value) which is about 36% of replacement cost (USD 26 mil.) of entire building. The repair time is approximately 12 months (median value).
10. CONCLUSIONS
Resilience-based design was carried out for a case-study building which was designed using performance-based seismic design approach. The building was designed to achieve a low probability of collapse under MCER earthquake. Intensity-based assessment was conducted for structural and nonstructural components under MCER earthquake to assess the extent of damage, repair cost and repair time. It was observed that there is a significant impact in terms of repair cost and repair time although the building was designed to satisfy the public safety requirements. In summary, resilience-based design approach can support the decision-making process of building developers and design professionals in quantifying the risk and reducing the uncertainty.
11. ACKNOWLEDGEMENT
Authors would like to express their deepest appreciation to the structural engineers who conducted performance-based seismic design and the developer of case-study building.
12. REFERENCES
FEMA P-58-1 (2018). Seismic performance assessment of buildings. Volume 1 – Methodology, Second Edition.
FEMA P-58-2 (2018). Seismic performance assessment of buildings. Volume 2 – Implementation guide, Second Edition.
FEMA P-58-7 (2018). Building the performance you need. A guide to state-of-the-art tools for seismic design and assessment.