![]()
| Basic Research | https://doi.org/10.21041/ra.v14i2.725 |
Shear behavior of autoclaved aerated concrete confined masonry walls with different scales
Comportamiento a cortante de muros de mampostería confinada de concreto celular de autoclave con diferentes escalas
Comportamento ao cisalhamento de paredes de alvenaria confinadas de concreto aerado autoclavadas com diferentes escalas
J. L. Varela-Rivera1* , J. Cacep-Rodriguez1, L. E. Fernandez-Baqueiro1, J. A. Moreno-Herrera1
1 Universidad Autónoma de Yucatán, Facultad de Ingeniería: Merida, Yucatán, MX.
*Contact author: vrivera@correo.uady.mx
Received: 12/02/2024
Revised: 03/04/2024
Accepted: 24/04/2024
Published: 15/05/2024
| Cite as: Varela-Rivera, J. L., Cacep-Rodriguez, J., Fernandez-Baqueiro, L. E., Moreno-Herrera, J. A. (2024), “Shear behavior of autoclaved aerated concrete confined masonry walls with different scales”, Revista ALCONPAT, 14 (2), pp. 157 - 173, DOI: https://doi.org/10.21041/ra.v14i2.725 |
ABSTRACT
An experimental study on the shear behavior of autoclaved aerated concrete (AAC) confined masonry walls is presented. A total of five reduced-scale walls were tested in the laboratory under reverse lateral loads. Variables studied were the geometric scaling factor and the aspect ratio of walls. Scales considered were 1:2 and 1:3. Based on the behavior of the reduced- and corresponding full-scale walls experimental scaling factors were determined. Existing geometric scaling factors were compared with corresponding experimental scaling factors. It was concluded that geometric scaling factors can be used to predict the shear strength and maximum shear strength of walls with scales of 1:2 and 1:3. Geometric scaling factors can only be used to predict stiffness and drift ratios associated with the maximum shear strength of walls.
Keywords: confined walls; autoclaved aerated concrete; scaling; shear behavior; in-plane reverse cyclic loads.
1. INTRODUCTION
Masonry structures are widely used in the construction industry in many countries around the world (Tena-Colunga et al., 2009). Confined masonry walls are constructed using different sort of units, for example, clay bricks, concrete blocks, and autoclaved aerated concrete (AAC) blocks, among others. Some of the problems in the masonry construction industry are the quality control in the block manufacturing and the labor quality control during the wall construction. In the first case, there are units fabricated with a low-quality control or in some cases units are handmade. In the second case, wall construction can be carried out by workers without any experience. By the other hand, mortar typically used for masonry walls is weaker than the units. This results, for example, in a wall shear behavior controlled by cracking on the masonry joints.
AAC confined walls are constructed following typical masonry construction procedures, but their behavior is similar to that observed in a monolithic wall, for example a reinforced concrete wall. This is mainly associated with the use of a thin bed mortar that provides a strong bond between AAC blocks. This means that thin bed mortar is stronger than the AAC units. Properties of thin bed mortar are specified in ASTM C1660 (ASTM C1660, 2018). AAC units are prefabricated with a high-quality control. Physical requirements for AAC are specified in ASTM C1693 (ASTM C1693, 2017) and RILEM (Aroni, 1993). In the United States of America, there are requirements for the design of AAC unreinforced and internally reinforced walls, but AAC confined walls are not included (TMS 402/602, 2022). In Mexico, there are requirements for the design of confined walls constructed with concrete blocks or clay bricks, but AAC confined walls are not explicitly considered (NTCM, 2020).
Today is a reality that there are few experimental studies on the behavior of full-scale masonry structures subjected to lateral loads (Aldemir et al., 2017; Chourasia et al., 2016; Gokmen et al., 2019; Henderson et al., 2003; Seible et al., 1994; Shahzada et al., 2012; Tanner et al., 2005a; Yi et al., 2006). This is mainly due to economic and space limitations in structural laboratories. An alternative has been the study of reduced-scale masonry structures but still the number of experimental studies is reduced (Abrams and Paulson, 1991; Alcocer et al., 1999; Benedetti et al., 1998; Henderson et al., 1994; Lourenço et al., 2013; San Bartolomé et al., 2009; Tomaževič, 1987; Tomaževič and Weiss, 1991; Wu et al., 2017). Another option has been the study of individual elements of the structures, for example, masonry walls. In this case, a larger number of experimental studies have been carried out by different authors (Bose and Rai, 2014; Perez Gavilan et al., 2015; Tena-Colunga et al., 2009; Tomaževič et al., 1996; Tomaževič and Gams, 2012; Tomaževič and Klemenc, 1997; Varela-Rivera et al., 2018; Varela-Rivera et al., 2019; Varela-Rivera et al., 2023; Yu et al., 2013). Full- and reduced-scale masonry walls have been considered in those studies. Reduced-scaled walls are important to save materials and time among others.
A literature review was conducted to identify experimental studies related to the behavior of AAC structures and AAC walls subjected to lateral loads. As a result, two studies were found on the behavior of full-scale AAC structures (Gokmen et al., 2019; Tanner et al., 2005a). In both cases, two-story structures with internally reinforced walls were considered. In the first case, the shear behavior of the walls was studied, and in the second, the flexural behavior. In the same way, a single study was found on the behavior of reduced-scale AAC structures (Tomaževič and Gams, 2012). Three- and four-story structures with internally reinforced walls were considered. Structures were constructed with a reduced scale of 1:4. The study focused on the shear behavior of the walls. On the other hand, some studies were found on the flexural and shear behavior of full-scale AAC unreinforced, internally reinforced, infill and confined walls (Penna et al., 2018; Ravichandran and Klingner, 2012; Shing et al., 1990; Tanner et al., 2005b; Tomaževič and Gams, 2012; Varela-Rivera et al., 2018; Varela-Rivera et al., 2023). For this last case, two studies were found where design equations for the shear strength and flexure-shear strength of AAC confined walls were proposed together with corresponding flexural design recommendations (Varela-Rivera et al., 2018; Varela-Rivera et al., 2023). In addition, three studies were found on the shear behavior of reduced-scale AAC walls (Bose and Rai, 2014; Tomaževič and Gams, 2012; Zhenggang et al., 2017). In the first case, internally reinforced walls were considered, and in the second and third cases, infill walls. Walls were constructed with reduced scales of 2:5, 1:2 and 1:4, respectively.
Based on the literature review presented above it is observed that reduced- and full-scale AAC structures are studied independently, that is, the behavior of the reduced-scale structures is not compared with that corresponding to full-scale structures. For example, the cracking pattern, strength, stiffness, and drift ratio of those reduced- and full-scale AAC structures are not compared. The behavior of those structures should be compared not only in the linear range but also in the nonlinear range. Similarly, the same situation is observed for the case of AAC walls, that is, the behavior of the reduced- and full-scale walls is not compared. In addition, it is observed that there are no experimental studies on the behavior of full- or reduced-scale AAC structures constructed with confined walls. Only two experimental studies on full-scale AAC internally reinforced walls were found (Gokmen et al., 2019; Tanner et al., 2005a). This shows the need to study the behavior of AAC structures constructed with confined walls to further understand their overall behavior under lateral loads. This can be done considering reduced-scale structures. As a first step, it is desirable to study the behavior of only the reduced-scale AAC confined walls and compare the results with those obtained from corresponding full-scale AAC confined walls.
In this study the shear behavior of five reduced-scale AAC confined walls was evaluated. Walls were tested under in-plane reverse cyclic lateral loads. Two walls were constructed with a scale of 1:2 and three with a scale of 1:3. Variables studied were the geometric scaling factor and the aspect ratio of walls. Lateral load - drift ratio curves were obtained for the walls. The shear behavior of the reduced-scaled AAC confined walls was compared with that observed for corresponding full-scale AAC walls obtained from the literature. Comparisons were based on the observed cracking pattern, strength, stiffness, and drift ratio of AAC confined walls. These comparisons were used to determine experimental scaling factors for the reduced-scale walls studied.
2. MATERIALS AND METHODS
2.1 Wall specimens and material properties
Five reduced-scale AAC confined walls were considered in this study, two walls with a scale of 1:2 and three with a scale of 1:3 (Table 1). Full-scale control AAC confined walls were previously studied by the authors (Varela-Rivera et al., 2023). These walls are presented in Table 1 with a scale of 1:1. The height (), length () and thickness () of walls are shown in Table 1. The wall height was measured up to the point of load application (Figure 1). The study variables were the geometric scaling factor and the aspect ratio () of walls (Table 1). The geometric scaling factor for the shear strength was defined as the ratio between the gross cross section area of a reduced-scale wall and that corresponding to a full-scale wall. The geometric scaling factor for the stiffness was defined as the ratio between the parameter () of a reduced-scale wall and that corresponding to a full-scale wall, where I is the gross moment of inertia of the wall. In that parameter both flexure and shear deformations are included. The geometric scaling factor for the drift ratio was defined as the ratio between the parameter [] of a reduced-scale wall and that corresponding to a full-scale wall.
Table 1. Details of AAC confined walls.
| AAC wall | Scale | (m) | (m) | (mm) | |
| W1-11* | 1:1 | 2.40 | 1.95 | 150 | 1.23 |
| W2-11* | 1:1 | 2.40 | 1.24 | 150 | 1.94 |
| W3-11* | 1:1 | 2.40 | 0.91 | 150 | 2.64 |
| W1-12 | 1:2 | 1.20 | 0.98 | 75 | 1.23 |
| W2-12 | 1:2 | 1.20 | 0.62 | 75 | 1.94 |
| W1-13 | 1:3 | 0.80 | 0.65 | 50 | 1.23 |
| W2-13 | 1:3 | 0.80 | 0.41 | 50 | 1.94 |
| W3-13 | 1:3 | 0.80 | 0.30 | 50 | 2.64 |
| *Varela-Rivera et al., 2023 |
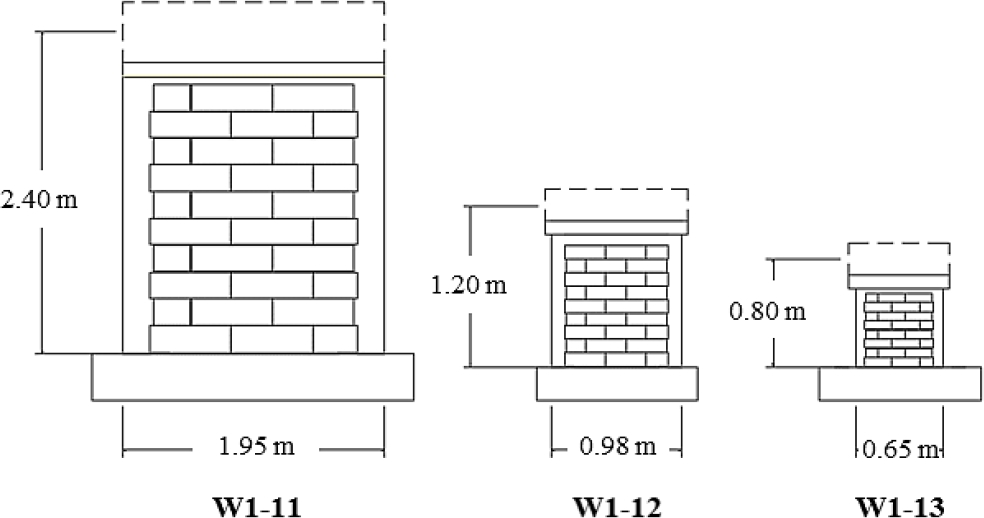
Figure 1. Layout of AAC confined walls.
An axial compressive stress of 0.29 MPa was considered for the walls. This compressive stress is related to a one-story AAC structure. It was assumed during the gravity load analysis that structures are built using AAC walls and AAC roof panels. AAC solid blocks were considered for the walls. For walls with a scale of 1:1, block dimensions were 0.15 x 0.20 x 0.61 m (width x height x length). For walls with scales of 1:2 and 1:3, block dimensions were approximately reduced by a factor of 2 and 3, respectively. Units were cut by using a band saw and, in particular cases, with a hand saw as recommended for AAC construction.
Wall W1-11 was designed to induce diagonal shear cracking and walls W2-11 and W3-11 to induce flexure-shear cracking (Varela-Rivera et al., 2023). Reduced-scale walls were designed to induced diagonal shear cracking. Final dimensions of cross sections (CS) and steel reinforcement details of confining elements (CE) of walls are presented in Table 2. The height of the cross section of vertical confining elements of walls, with a scale of 1:2, was 110 mm (Table 2). This height was required to induce diagonal shear cracking in these walls. Longitudinal reinforcement (LR) consisted of deformed steel bars with nominal yield strength of 412 MPa. Transverse reinforcement (TR) consisted of plain steel bars with nominal yield strength of 248 MPa. This type of plain steel is widely used in Mexico for masonry and reinforced concrete structures. No transverse reinforcement was used for the reduced-scale walls (Table 2). This was related to the small dimensions of the corresponding cross sections of vertical confining elements. Maximum size of coarse aggregate of concrete of vertical confining elements of walls with scales of 1:1 and 1:2 were 19 mm and 9.52 mm, respectively. For walls with a scale of 1:3, mortar was used instead of concrete. Mortar was, in proportions by volume, 1:2 (Portland cement: sand). The final aspect ratio of walls is presented in Table 1. Specified compressive strength of concrete of vertical confining elements of walls with a scale of 1:1 was 14.7 MPa. Specified compressive strength of concrete and mortar of vertical confining elements of walls with a scale of 1:2 and 1:3 was 19.6 MPa. This change in the specified compressive strength was associated with the change in the minimum compressive strength of concrete prescribed in the new version of the Mexico City Masonry Technical Norm (NTCM, 2020). Corresponding walls with different scales, for example, walls W1-11, W1-12 and W1-13 had the same aspect ratio.
Table 2. Details of vertical confining elements of walls.
| AAC wall | CS of CE (mm) | LR | TR |
| W1-11 (a) W2-11 and W3-11 (b) | 4#3 | #2@ 200 mm | |
| W1-12 to W2-12 | 1#4 | - | |
| W1-13 (a) W2-13 and W3-13 (b) | 1#3 | - |
Mechanical properties of AAC, leveling bed mortar, thin bed mortar, and concrete and mortar of vertical confining elements determined for the walls are presented in Table 3. All properties were determined using regular specimen sizes as specified in corresponding ASTM standards (Table 3) (ASTM C109, 2021; ASTM C1693, 2017; ASTM C39, 2023). This means that no reduction in the size of the corresponding specimens was considered for the reduced-scale walls.
Table 3. Material properties of walls.
| Property | AAC wall | ASTM | Average (MPa) | CV |
| Compressive strength of AAC () | W1-11 to W3-11 | C1693 | 5.28 | 0.04 |
| W1-12 to W2-12 | 4.69 | 0.02 | ||
| W1-13 to W3-13 | 5.28 | 0.04 | ||
| Compressive strength of leveling bed mortar () | W1-11 to W3-11 | C109 | 22.36 | 0.03 |
| W1-12 to W2-12 | 17.92 | 0.02 | ||
| W1-13 to W3-13 | 14.59 | 0.05 | ||
| Compressive strength of thin bed mortar () | W1-11 to W3-11 | C109 | 17.81 | 0.02 |
| W1-12 to W2-12 | 10.52 | 0.02 | ||
| W1-13 to W3-13 | 17.81 | 0.02 | ||
| Compressive strength of concrete of vertical CE () | W1-11 to W3-11 | C39 | 15.85 | 0.02 |
| W1-12 to W2-12 | 25.10 | 0.07 | ||
| Compressive strength of mortar of vertical CE () | W1-13 to W3-13 | C109 | 23.92 | 0.02 |
2.2 Wall construction
AAC confined walls were constructed in half running bond by an experienced worker. The first block course was laid using both mortar in proportions by volume 1:3 (Portland cement: sand) and thin bed mortar. The first one was used on the leveling bed joint and the second on the head joints. Subsequent block courses were laid using only thin bed mortar. The average thickness of the leveling bed mortar of walls with scales of 1:1, 1:2 and 1:3 was about 10 mm, 5 mm, and 3.3 mm, respectively. Average thickness of thin bed mortar of walls with scales of 1:1, 1:2 and 1:3 was about 3 mm, 2 mm, and 2 mm, respectively. Construction of walls was as follows, first the block courses were laid and later the vertical confining elements were concrete cast. Finally, the top confining element was cast. A 25 mm tooth was used in end blocks of alternating courses of walls with a scale of 1:1. This tooth was reduced by a factor of 2 and 3 for walls with reduced scales of 1:2 and 1:3, respectively. The wall layout of walls W1-11, W1-12 and W1-13 is presented in Figure 1.
2.3 Wall test setup
Each AAC reduced-scale confined wall was tested with constant axial load and reverse monotonic cyclic lateral loads until failure. Axial loads were calculated using the axial compressive stress of 0.29 MPa, and corresponding wall length and wall thickness (Table 1). Lateral loads were applied using a steel reaction frame, a loading steel beam, and a two-way hydraulic actuator (Figure 2a). Lateral load was measured using a tension-compression donut type load cell. This load was verified using two pressure transducers. Wall specimens were connected to an elevated reaction slab which was attached to the lab reaction floor. Axial load was applied using a swivel beam, a spreader beam, two threaded rods and a hydraulic actuator (Figure 2b). Pressure in the actuator was maintained constant during the test using a mechanical load maintainer (Edison, 1994). Axial load was measured using two donut type load cells. This load was verified using a pressure transducer. Full-scale walls were tested using similar conditions (Varela-Rivera et al., 2023).
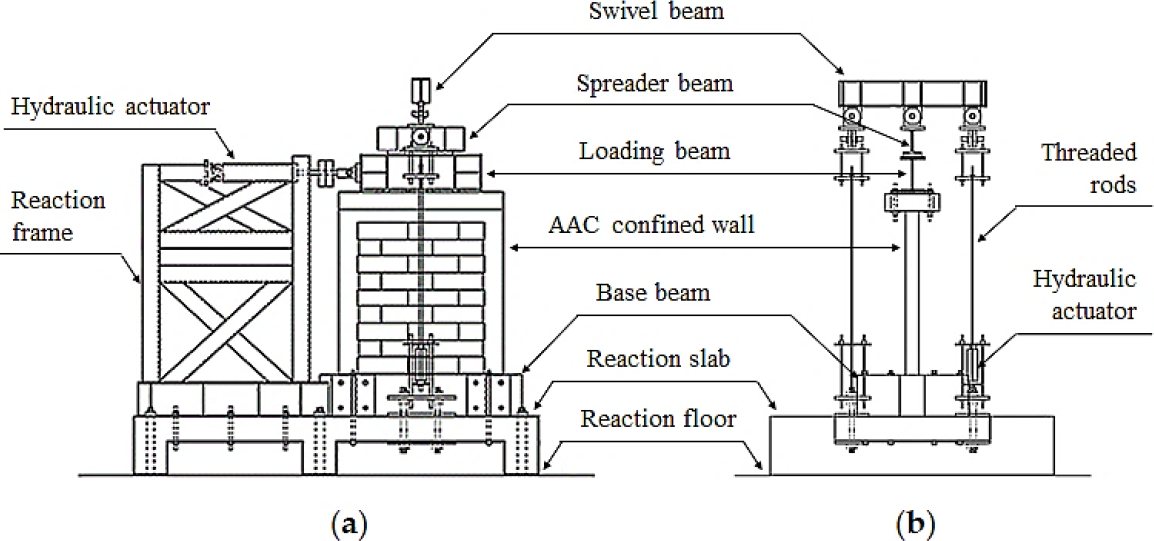
Figure 2. Wall test setup. (a) Lateral load test setup; (b) Axial load test setup.
2.4 Wall instrumentation and loading history
Horizontal and vertical wall displacements of reduced-scale walls were measured using linear string potentiometers (SP). Relative displacements between the loading beam and the wall, the wall and the elevated reaction slab, and the elevated reaction slab and the reaction floor were measured using linear potentiometers (LP). A typical view of the wall instrumentation is presented in Figure 3. In this figure, DLC refers to the donut type load cell. The loading history used to test the walls was based on the protocol established in the Mexico City Masonry Technical Norm (NTCM, 2020). This loading history has four initial reverse cycles controlled by load and subsequent cycles controlled by drift ratios. Similar instrumentation and loading history were used for the full-scale walls (Varela-Rivera et al., 2023).
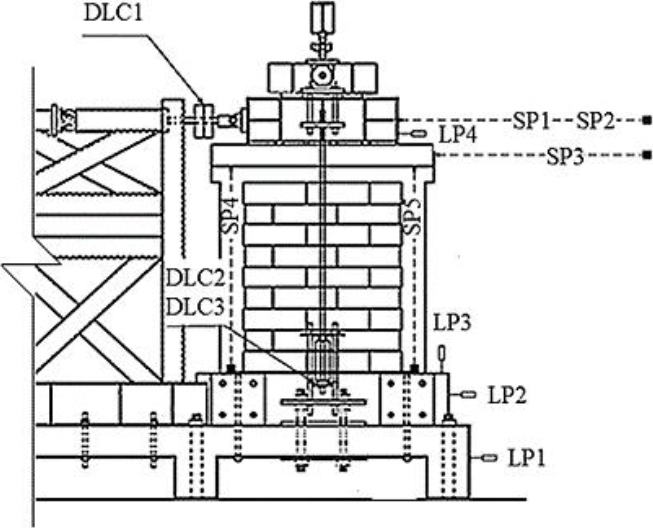
Figure 3. Typical view of wall instrumentation.
3. RESULTS
3.1 Material properties
Average properties of AAC, leveling bed mortar, thin bed mortar, and concrete and mortar of vertical confining elements of walls are reported in Table 3. Corresponding coefficients of variation (CV) are included in that table. The average compressive strength of AAC of walls with a scale of 1:2 was 11% lower than that obtained for walls with a scale of 1:1 and 1:3, respectively. Similarly, the average compressive strength of thin bed mortar used for walls with a scale of 1:2 was 41% lower than that used for walls with a scale of 1:1 and 1:3. AAC and thin bed mortar used for walls with a scale 1:2 came from a different manufacturer. The behavior of the reduced-scaled walls was not affected by these differences as described later.
3.2 Overall behavior of reduced-scale walls
The behavior of walls with a scale of 1:2 was in general similar. The behavior was characterized by the formation of horizontal flexural cracks on the bottom part of vertical confining elements. After this, diagonal shear cracks were observed on the wall panel together with new flexural cracks over the length of vertical confining elements. For the case of wall W2-12, flexure-shear cracks were observed before the formation of diagonal shear cracks. It was observed during the design procedure of this wall that prediction loads associated with both types of cracks were similar. As the drift ratio increased, new diagonal cracks were observed on the wall panel forming the traditional “X” final cracking pattern. Failure of the walls was associated with the propagation of diagonal shear cracks into the ends of vertical confining elements. The behavior of walls with a scale of 1:3 was, in general, similar to that observed for wall W1-12. Final cracking pattern and failure type of walls with a scale of 1:3 were also similar to those observed for walls with a scale of 1:2. The cracking pattern of reduced-scale walls at maximum lateral load is presented in Figure 4. The lateral load - drift ratio curves of those walls are presented in Figure 5.
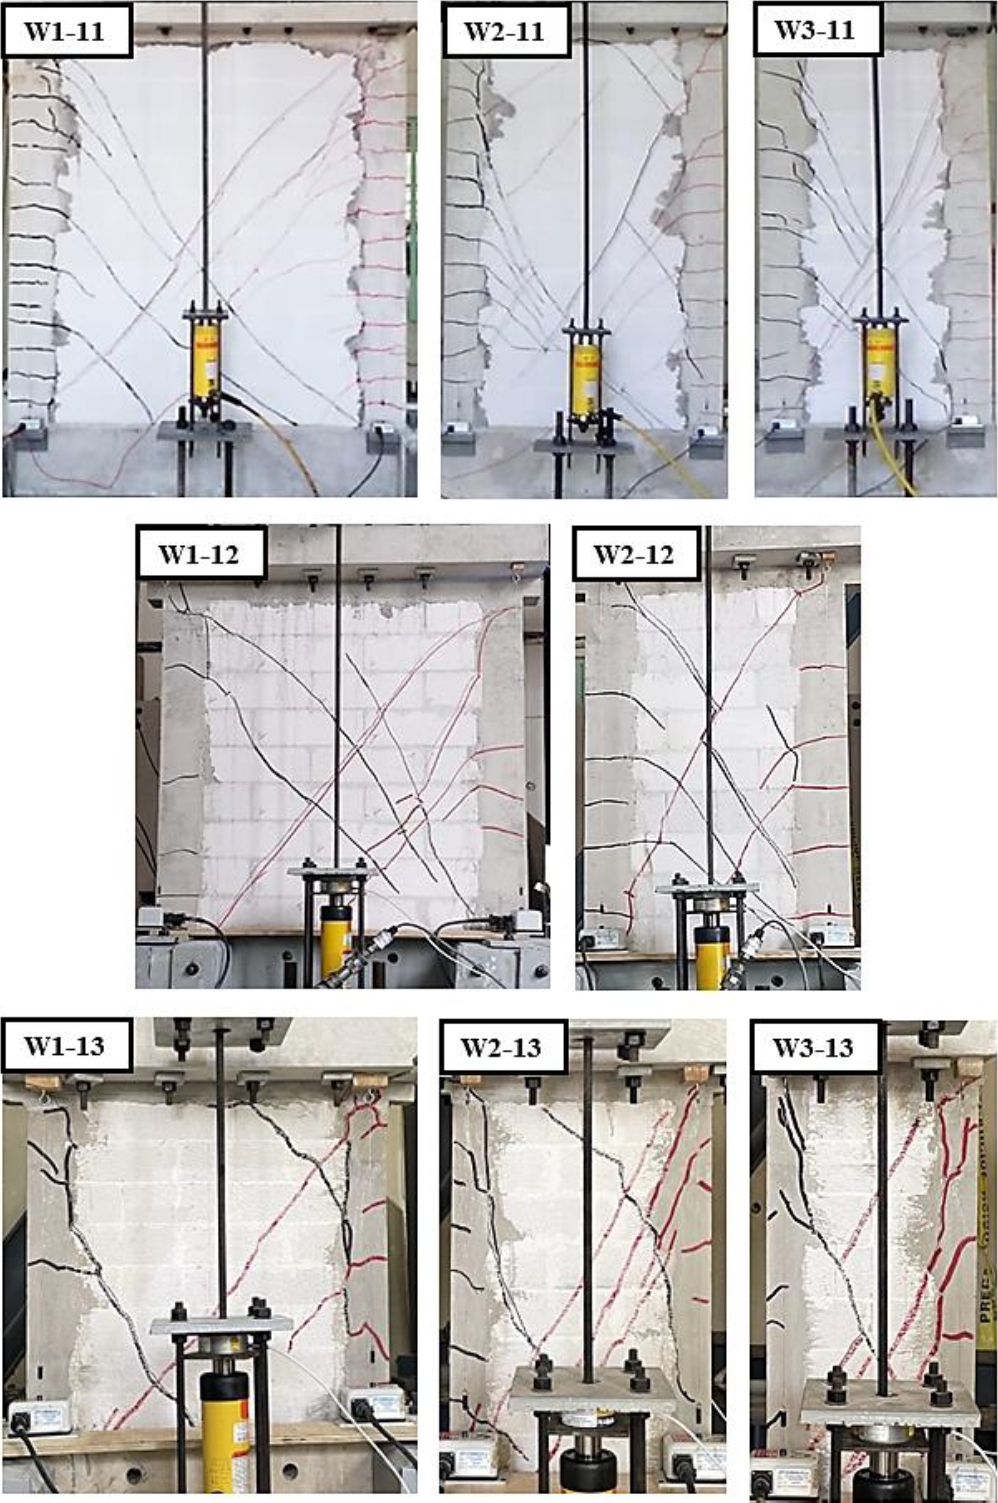
Figure 4. Cracking patterns associated with maximum lateral load of walls.
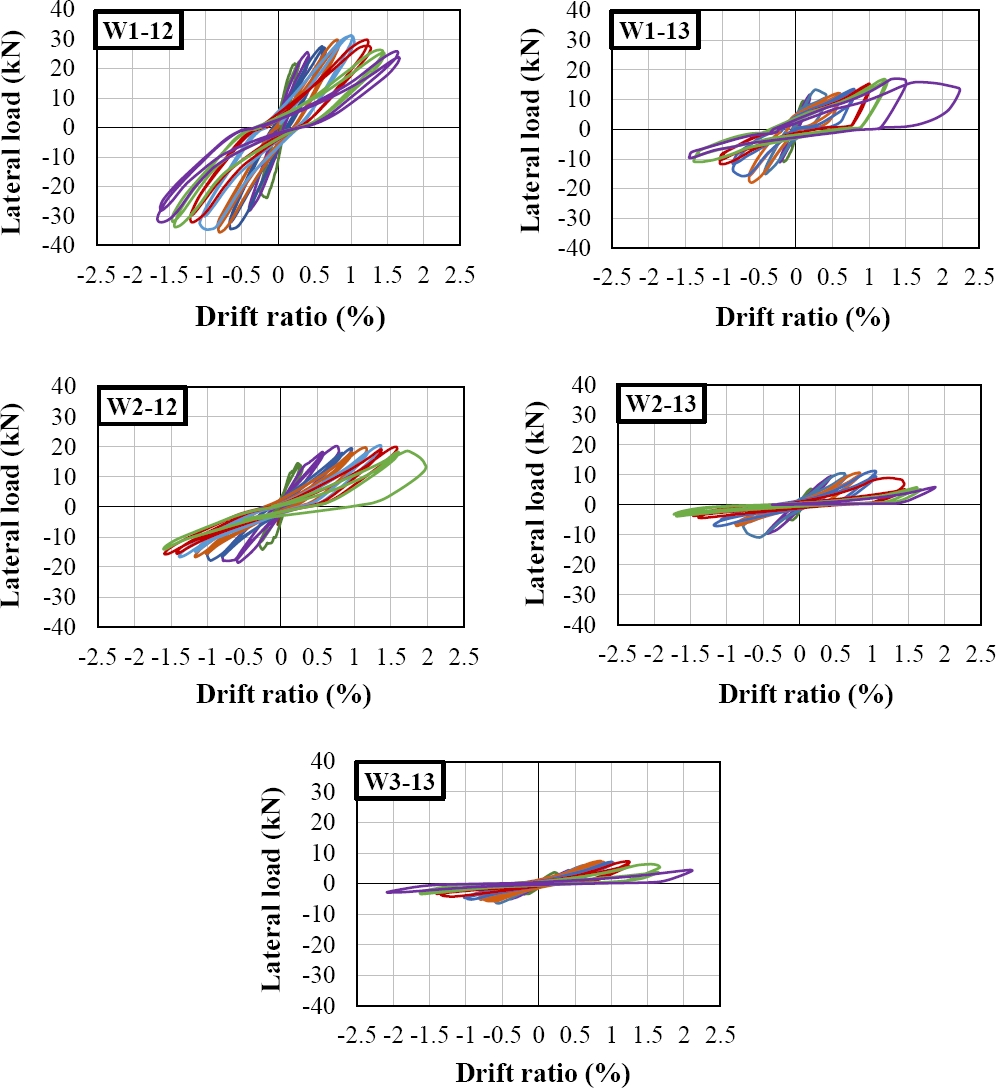
Figure 5. Lateral load - drift ratio curves for reduced-scale walls.
4. DISCUSSION
4.1 Cracking pattern of walls with different scales
The cracking pattern of walls with scales of 1:1, 1:2 and 1:3 is presented in Figure 4. This cracking pattern was associated with the maximum lateral load of walls in the positive load cycles. The cracking pattern of walls with scales of 1:1, 1:2 and 1:3 was in general similar (Figure 4). This cracking pattern was mainly associated with horizontal flexural cracks along the height of vertical confining elements and diagonal shear cracks on the AAC wall panel. For the case of walls W2-11, W3-11, and W2-12 some flexural-shear cracks were also observed as described before. Diagonal cracks observed on walls were formed within the AAC units and not at the joints; that is, stair-step type cracks were not observed. This means that the AAC confined walls behaved as monolithic walls, for example, thin bed mortar was stronger than the AAC blocks (Table 3). Stair-step type cracks are commonly observed in confined walls constructed with clay or concrete units with mortar weaker than units. Based on this comparison it was observed that cracking pattern of walls was not dependent of the geometric scales and the wall aspect ratios studied.
4.2 Shear strength of walls with different scales
The experimental shear strength () of walls are presented in Table 4. These strengths were associated with first diagonal shear cracking (DSC) or first flexure-shear cracking (FSC). Only positive load cycles were considered. The experimental maximum shear strength () of walls are also included in Table 4. This strength was associated with the maximum lateral load observed in positive load cycles. The shear strength of walls with the same scale increased as the aspect ratio decreased (Table 4). For example, the shear strength of wall W1-13 with an aspect ratio of 1.23 was 144% greater than that of wall W3-13 with an aspect ratio of 2.64. Experimental scaling factors were determined for the shear strength () of walls with scales of 1:2 and 1:3 (Table 4). Scaling factors were calculated as the ratio between the shear strength of reduced-scale walls and that corresponding to full-scale walls. This scaling factor is related to the linear behavior of walls. Similarly, experimental scaling factors were determined for the maximum shear strength () of walls with scales of 1:2 and 1:3 (Table 4). In this case, the scaling factor is related to the nonlinear behavior of walls. The average values of and for walls with a scale of 1:2 were 0.27 and 0.24, respectively. Similarly, the average values of and for walls with a scale of 1:3 were 0.10 and 0.13. For walls with scales of 1:2 and 1:3 the geometric scaling factors for the shear strength () were 0.25 and 0.11, respectively (Table 4). It was observed that geometric and experimental scaling factors for the shear strength and maximum shear strength of walls were similar. The shear strength of walls is mainly associated with the gross cross-section area of walls, for example length and thickness of walls.
Table 4. Experimental strength scaling factors for walls.
| AAC wall | (kN) | Type of cracking | Average | (kN) | Average | ||||
| W1-11* | 1.23 | 101.40 | DSC | 1 | 1 | 140.51 | 1 | 1 | 1 |
| W2-11* | 1.94 | 45.44 | FSC | 1 | 74.53 | 1 | |||
| W3-11* | 2.64 | 35.53 | FSC | 1 | 48.08 | 1 | |||
| W1-12 | 1.23 | 21.24 | DSC | 0.21 | 0.27 | 29.85 | 0.21 | 0.24 | 0.25 |
| W2-12 | 1.94 | 14.48 | FSC | 0.32 | 19.48 | 0.26 | |||
| W1-13 | 1.23 | 9.07 | DSC | 0.09 | 0.10 | 12.09 | 0.09 | 0.13 | 0.11 |
| W2-13 | 1.94 | 5.31 | DSC | 0.12 | 11.28 | 0.15 | |||
| W3-13 | 2.64 | 3.71 | DSC | 0.10 | 7.30 | 0.15 |
| *Varela-Rivera et al. (2023) |
4.3 Stiffness of walls with different scales
The experimental secant stiffness at shear strength () and at maximum shear strength () of walls are presented in Table 5. Only positive load cycles were considered. Experimental scaling factors were determined for the secant stiffness at shear strength () and at maximum shear strength () of walls with scales of 1:2 and 1:3 (Table 5). The average values of and for walls with a scale of 1:2 were 0.36 and 0.48, respectively. Similarly, the average values of and for walls with a scale of 1:3 were 0.44 and 0.40, respectively. For walls with a scale of 1:2 and 1:3, the geometric scaling factors for the stiffness () are 0.50 and 0.33, respectively (Table 5). For walls with a scale of 1:2 the geometric scaling factor for the stiffness was greater than but it was similar to (Table 5). This shows that is overestimated but is well approximated with geometric scaling factors. For walls with a scale of 1:3 the geometric scaling factor for the stiffness was smaller than and (Table 5). This shows that and are both underestimated with geometric scaling factors. Experimental stiffness scaling factors include the contribution of the steel reinforcement and concrete of vertical confining elements together with the contribution of the unreinforced AAC wall panel. This is typically considered using transformed properties of the wall cross-section. On the contrary, corresponding geometric scaling factors for the stiffness are calculated using only gross properties of the wall cross-section.
Table 5. Experimental stiffness scaling factors for walls.
| AAC wall | (kN/cm) | Average | (kN/cm) | Average | ||||
| W1-11* | 1.23 | 297.86 | 1 | 1 | 77.34 | 1 | 1 | 1 |
| W2-11* | 1.94 | 126.33 | 1 | 30.58 | 1 | |||
| W3-11* | 2.64 | 41.28 | 1 | 16.59 | 1 | |||
| W1-12 | 1.23 | 87.63 | 0.29 | 0.36 | 30.68 | 0.40 | 0.48 | 0.50 |
| W2-12 | 1.94 | 53.64 | 0.42 | 16.96 | 0.55 | |||
| W1-13 | 1.23 | 135.56 | 0.46 | 0.44 | 25.22 | 0.33 | 0.40 | 0.33 |
| W2-13 | 1.94 | 42.61 | 0.34 | 13.51 | 0.44 | |||
| W3-13 | 2.64 | 21.66 | 0.52 | 7.38 | 0.44 |
| *Varela-Rivera et al. (2023) |
4.4 Drif ratio of walls with different scales
The experimental drift ratio at shear strength () and at maximum shear strength () of walls are presented in Table 6. Only positive load cycles were considered. The drift ratio of walls with the same scale increased as the aspect ratio increased (Table 6). For example, the drift ratio of wall W3-13 with an aspect ratio of 2.64 was 163% greater than that of wall W1-13 with an aspect ratio of 1.23. Experimental scaling factors were determined for the drift ratio at shear strength (), and maximum shear strength () of walls with scales of 1:2 and 1:3 (Table 6). The average values of and for walls with a scale of 1:2 were 1.46 and 1.01, respectively. Similarly, the average values of and for walls with a scale of 1:3 were 0.74 and 0.95, respectively. For walls with a scale of 1:2 and 1:3, the geometric scaling factors for the drift ratio () are both 1.0 (Table 6). This shows that for walls with a scale of 1:2 the geometric scaling factor for the drift ratio was smaller than but it was similar to . For walls with a scale of 1:3 the geometric scaling factor was greater than and . This is associated with the same reasons described before for the experimental stiffness scaling factors.
Table 6. Experimental drift ratio scaling factors for walls.
| AAC wall | (%) | Average | (%) | Average | ||||
| W1-11* | 1.23 | 0.14 | 1 | 1 | 0.76 | 1 | 1 | 1 |
| W2-11* | 1.94 | 0.15 | 1 | 1.02 | 1 | |||
| W3-11* | 2.64 | 0.36 | 1 | 1.21 | 1 | |||
| W1-12 | 1.23 | 0.20 | 1.42 | 1.46 | 0.81 | 1.07 | 1.01 | 1 |
| W2-12 | 1.94 | 0.22 | 1.50 | 0.96 | 0.94 | |||
| W1-13 | 1.23 | 0.08 | 0.59 | 0.74 | 0.60 | 0.79 | 0.95 | 1 |
| W2-13 | 1.94 | 0.16 | 1.04 | 1.04 | 1.03 | |||
| W3-13 | 2.64 | 0.21 | 0.60 | 1.24 | 1.02 |
| *Varela-Rivera et al. (2023) |
5. CONCLUSIONS
The shear behavior of five AAC confined walls with reduced scales of 1:2 and 1:3 was evaluated. The behavior of the reduced-scale AAC confined walls was compared with that observed for corresponding full-scale AAC confined walls obtained from Varela-Rivera et al. (2023). Based on the corresponding comparisons, the following conclusions are presented:
The cracking pattern of walls with scales of 1:1, 1:2 and 1:3 was in general similar. This cracking pattern was mainly associated with horizontal flexural cracks along the height of vertical confining elements and diagonal shear cracks on the AAC wall panel. This shows that cracking pattern of walls was not dependent of the scales and the wall aspect ratios studied.
For walls with scales of 1:2 and 1:3 the geometric scaling factors for the shear strength and maximum shear strength were similar to corresponding experimental scaling factors. This shows that shear strength and maximum shear strength of walls with scales of 1:2 and 1:3 can be predicted using geometric scaling factors.
For walls with a scale of 1:2 the geometric scaling factor for the stiffness was greater than that observed at shear strength, but it was similar to that observed at maximum shear strength. For walls with a scale of 1:3 the geometric scaling factor for the stiffness was smaller than those observed at shear strength and at maximum shear strength. Geometric scaling factors can be used only to predict the stiffness at maximum shear strength of walls with a scale of 1:2 but are not recommended for walls with a scale of 1:3.
For walls with a scale of 1:2 the geometric scaling factor for the drift ratio was smaller than that observed at shear strength, but it was similar to that observed at maximum shear strength. For walls with a scale of 1:3 the geometric scaling factor was greater than those observed at shear strength and at maximum shear strength. Geometric scaling factors are not recommended to predict the drift ratio at shear strength of walls with scales of 1:2 and 1:3. Geometric scaling factors can be used only to predict the drift ratio at maximum shear strength of walls with scales of 1:2 and 1:3.
6. ACKNOWLEDGEMENTS
This research was funded by Consejo Nacional de Humanidades, Ciencias y Tecnologias (CONAHCYT), project number: 288718. AAC was provided for Aircrete Mexico and Litecrete Mexico. The second author received a scholarship from CONAHCYT. The authors thank the work done by the following former graduate students: Eduardo Ricalde-Canto and Edwin Sanchez-Dorantes.
7. REFERENCES
Abrams, D., Paulson, T. J. (1991), Modeling Earthquake Response of Concrete Masonry Building Structures. ACI Struct. J. 88(4):475-485. https://doi.org/10.14359/3093
Alcocer, S. M., Murià-Vila, D., Peña-Pedroza, J. I. (1999). “Comportamiento dinámico de muros de mampostería confinada” em: Series del Institutito de Ingeniería, 616, UNAM: Ciudad de México, México. (en español).
Aldemir, A., Binici, B., Canbay, E., Yakut, A. (2017), Lateral load testing of an existing two-story masonry building up to near collapse. B. Earthq. Eng. 15(8):3365-3383. https://doi.org/10.1007/s10518-015-9821-3
Aroni, S., de Groot, G. J., Robinson, M. J., Svanholm, G., Wittman, F. H. (1993), “Autoclaved Aerated Concrete: Properties, Testing, and Design: RILEM Recommended Practice”. 1ra. ed., E & FN Spon: Londres, UK.
ASTM Internacional. (2017). ASTM C1693/C1693-11: Standard Specification for Autoclaved Aerated Concrete (AAC). West Conshohocken, PA, EUA. https://doi.org/10.1520/C1693-11R17
ASTM Internacional. (2021). ASTM C109/C109M-21: Standard Test Method for Compressive Strength of Hydraulic Cement Mortars (Using 2 - in. or [50 - mm] Cube Specimens). West Conshohocken, PA, EUA. https://doi.org/10.1520/C0109_C0109M-21
ASTM Internacional. (2023). ASTM C39/C39M-23: Standard Test Method for Compressive Strength of Cylindrical Concrete Specimens. West Conshohocken, PA, EUA. https://doi.org/10.1520/C0039_C0039M-23
Benedetti, D., Carydis, P., Pezzoli, P. (1998), Shaking table tests on 24 simple masonry buildings. Earthq. Eng. Struct. D. 27(1):67-90. https://doi.org/10.1002/(SICI)1096-9845(199801)27:1<67::AID-EQE719>3.0.CO;2-K
Bose, S., Rai, D. C. (2014). “Behavior of AAC Infilled RC Frame Under Lateral Loading” en: Proceedings of the 10th National Conference in Earthquake Engineering, Anchorage, Alaska.
Chourasia, A., Bhattacharyya, S. K., Bhandari, N. M., Bhargava, P. (2016), Seismic Performance of Different Masonry Buildings: Full-Scale Experimental Study. J. Perform. Constr. Fac. 30(5):1-12. https://doi.org/10.1061/(ASCE)CF.1943-5509.0000850
Edison Hydraulic Load Maintainers (1994), “Operation and Maintenance Manual”. Edison Hydraulic Load Maintainers, Paradise, CA, EUA.
Gokmen, F., Binici, B., Aldemir, A., Taghipour, A., Canbay, E. (2019), Seismic behavior of autoclaved aerated concrete low-rise buildings with reinforced wall panels. B. Earthq. Eng. 17(7):3933-3957. https://doi.org/10.1007/s10518-019-00630-3
Henderson, R. C., Fricke, K. E., Jones, W. D., Beavers, J. E., Bennett, R. M. (2003), Summary of a Large- and Small-Scale Unreinforced Masonry Infill Test Program. J. Struct. Eng., 129(12):1667-1675. https://doi.org/10.1061/(ASCE)0733-9445(2003)129:12(1667)
Lourenço, P. B., Avila, L., Vasconcelos, G., Alves, J. P., Mendes, N., Costa, A. C. (2013), Experimental investigation on the seismic performance of masonry buildings using shaking table testing. B. Earthq. Eng. 11:1157-1190. https://doi.org/10.1007/s10518-012-9410-7
Normas Técnicas Complementarias. (2020). NTCM: Normas Técnicas Complementarias para el Diseño y Construcción de Estructuras de Mampostería (em espanhol). Cidade do México, México.
Penna, A., Magenes, G., Calvi, G. M., Costa, A. A. (2008). “Seismic Performance of AAC Infill and Bearing Walls with Different Reinforcement Solutions” en: Proceedings of the 14th International Brick and Block Masonry Conference, Sidney, Australia.
Pérez-Gavilán, J. J., Flores, L. E., Alcocer, S. M. (2015), An Experimental Study of Confined Masonry Walls with Varying Aspect Ratios. Earthq. Spectra. 31(2):945-968. https://doi.org/10.1193/090712eqs284m
Ravichandran, S. S., Klingner, R. E. (2012), Behavior of Steel Moment Frames with Autoclaved Aerated Concrete Infills. ACI Struct. J. 109(1):83-90. https://doi.org/10.14359/51683497
Rosado-Gruintal, A. I. (2014). Desempeño elástico y plástico del concreto fabricado con agregados reciclados de origen calizo de residuos de demolición. Tesis de Maestría, Universidad Autónoma de Yucatán. (em espanhol).
San Bartolomé, A., Delgado, E., Quiun, D. (2009). “Seismic behavior of a two-story model of confined adobe masonry” en: Proceedings of the 11th Canadian Symposium, Toronto, Ontario, Canadá.
Shahzada, K., Khan, A. N., Elnashai, A. S., Ashraf, M., Javed, M., Naseer, A., Alam, B. (2012), Experimental Seismic Performance Evaluation of Unreinforced Brick Masonry Buildings. Earthq. Spectra. 28(3):1269-1290. https://doi.org/10.1193/1.4000073
Seible, F., Priestley, M. J. N., Kingsley, G. R., Kürkchübasche, A. G. (1994), Seismic Response of Full‐Scale Five‐Story Reinforced Masonry Building. J. Struct. Eng. 120(3):925-946. https://doi.org/10.1061/(ASCE)0733-9445(1994)120:3(925)
Shing, P. B., Schuller, M., Hoskere, V. S. (1990), In‐Plane Resistance of Reinforced Masonry Shear Walls. J. Struct. Eng. 116(3):619-640. https://doi.org/10.1061/(ASCE)0733-9445(1990)116:3(619)
Tanner, J. E., Varela-Rivera, J. L., Klinger, R. E. (2005), Design and Seismic Testing of Two-Story, Full Scale Autoclaved Aerated Concrete Assemblage Specimen. ACI Struct. J. 102(1):114-119. https://doi.org/10.14359/13536
Tanner, J. E., Varela-Rivera, J. L., Klinger, R. E., Brightman, M. J. (2005), Seismic Testing of Autoclaved Aerated Concrete Shear-Walls: A Comprehensive Review. ACI Struct. J. 102(3):374-382. https://doi.org/10.14359/14408
Tena-Colunga, A., Juárez-Ángeles, A., Salinas-Vallejo, V. H. (2009), Cyclic Behavior of Combined and Confined Masonry Walls. Eng. Struct. 31(1):240-259. https://doi.org/10.1016/j.engstruct.2008.08.015
The Masonry Society. (2022). TMS 402/602-22: Building Code Requirements and Specifications for Masonry Structures (Formerly ACI 530). Longmont, CO.
Tomaževič, M. (1987), Dynamic modelling of masonry buildings: Storey mechanism model as a simple alternative. Earthq. Eng. Struct. D. 15(6):731-749. https://doi.org/10.1002/eqe.4290150606
Tomaževič, M., Gams, M. (2012), Shaking Table Study and Modelling of Seismic Behavior of Confined AAC Masonry Buildings. B. Earthq. Eng. 10(3):863-893. https://doi.org/10.1007/s10518-011-9331-x
Tomaževič, M., Klemenc, I. (1997), Seismic behavior of confined masonry walls. Earthq. Eng. Struct. D. 26(10):1059-1071. https://doi.org/10.1002/(SICI)1096-9845(199710)26:10<1059::AID-EQE694>3.0.CO;2-M
Tomaževič, M., Lutman, M., Petkovic, L. (1996), Seismic Behavior of Masonry Walls: Experimental Simulation. J. Struct. Eng. 122(9):1040-1047. https://doi.org/10.1061/(ASCE)0733-9445(1996)122:9(1040)
Tomaževič, M., Weiss, P. (1991). “Seismic behavior of masonry buildings: reinforced versus unreinforced masonry” em: Proceedings of the 9th International Brick and Block Masonry Conference, Berlín, Alemania, pp. 552-559.
Varela-Rivera, J. L., Fernández-Baqueiro, L., Alcocer-Canché, R., Ricalde-Jiménez, J., Chim-May, R. (2018), Shear and Flexural Behavior of Autoclaved Aerated Concrete Confined Masonry Walls. ACI Struct. J. 115(5):1453-1462. https://doi.org/10.14359/51706828
Varela-Rivera, J. L., Fernández-Baqueiro, L., Gamboa-Villegas, J., Prieto-Coyoc, A., Moreno-Herrera, J. (2019), Flexural Behavior of Confined Masonry Walls Subjected to In-Plane Lateral Loads. Earthq. Spectra. 35(1):405-422. https://doi.org/10.1193/112017eqs239m
Varela-Rivera, J. L., Fernández-Baqueiro, L., Moreno-Herrera, J. (2023), Shear and Flexure-Shear Strengths of Autoclaved Aerated Concrete Confined Masonry Walls. ACI Struct. J. 120(3):207-215. https://doi.org/10.14359/51738511
Wu, F., Wang, H. T., Li, G., Jia, J. Q., Li, H. N. (2017), Seismic performance of traditional adobe masonry walls subjected to in-plane cyclic loading. Mater. Struct. 50(69):1-14. https://doi.org/10.1617/s11527-016-0927-0
Yi, T., Moon, F. L., Leon, R. T., Kahn, L. F. (2006), Lateral Load Tests on a Two-Story Unreinforced Masonry Building. J. Struct. Eng. 132(5):643-652. https://doi.org/10.1061/(ASCE)0733-9445(2006)132:5(643)
Yu, J., Cao, J., Fei, T. (2013), Experimental Study on Improving Seismic Behavior of Load-Bearing Masonry Wall Made of Autoclaved Aerated Concrete. Trans. Tianjin Univ. 19(6):419-424. https://doi.org/10.1007/s12209-013-2121-6
Zhenggang, C., Peng, D., Feng, F., Ming, F. (2017), Cyclic testing and parametric analyses of the fabricated steel frames infilled with autoclaved aerated concrete panels. Adv. Struct. Eng. 20(4):629-640. https://doi.org/10.1177/1369433216659288