![]()
| Basic Research | https://doi.org/10.21041/ra.v14i2.705 |
An approach to digital image correlation for measurements of masonry specimens in laboratory
Un acercamiento a la correlación de imágenes digitales para mediciones de especímenes de mampostería en laboratorio
Uma abordagem à correlação de imagens digitais para medições de espécimes de alvenaria em laboratório
J. H. Chávez-Gómez1 , M. Mesa-Lavista1*, J. Álvarez Pérez1, F. Yépez-Rincón1, E. Valencia-Guzmán1, R. González-Alcorta1
1 Departamento de Ingeniería Estructural y Peritajes, Facultad de Ingeniería Civil, Universidad Autónoma de Nuevo León, Nuevo León, México.
*Contact author: mmesal@uanl.edu.mx
Received: 24/10/2023
Revised: 09/04/2024
Accepted: 27/04/2024
Published: 15/05/2024
| Cite as: Chávez-Gómez, J. H., Mesa-Lavista, M., Álvarez Pérez, J., Yépez-Rincón, F., Valencia-Guzmán, E., González-Alcorta, R. (2024), “An approach to digital image correlation for measurements of masonry specimens in laboratory”, Revista ALCONPAT, 14 (2), pp. 174 - 190, DOI: https://doi.org/10.21041/ra.v14i2.705 |
ABSTRACT
The aim of the work is to employ the Digital Image Correlation (DIC) technique to analyze displacements in masonry wallettes under axial compression, without using commercial software. An algorithm was developed using the Newton Raphson numerical method for this purpose. The results obtained were compared with measurements from the Linear Variable Differential Transformer (LVDT), validating the effectiveness of the algorithm and comparing them with previous studies, with acceptable errors. This work is part of an ongoing project at the Civil Engineering Institute of the Autonomous University of Nuevo León, laying the groundwork for future research on the implementation of the technique for obtaining pathologies and deformation states in masonry structures. As the main conclusion, it was determined that DIC can be used as a reliable method for measuring displacements and deformations in laboratory tests.
Keywords: digital image correlation; masonry.
1. INTRODUCTION
Digital Image Correlation (DIC) is a method of optical measurement, precise and practical; capable of mapping a complete displacement field of a deformed object of interest. It consists of processing photographic images taken of a surface previously prepared with a random speckle pattern. This surface suffers deformations from being subjected to a state of loads.
Through image processing it is possible to obtain the displacement field of a specific structure, as an alternative to the typical measuring devices, and can map a complete displacement field. Currently a project is being carried out that has as the main aim evaluating the effectiveness of the digital image correlation method in masonry wallettes. The wallettes were fabricated in the laboratory out of hollow concrete blocks and subjected to axial compression. Additionally, in this project, the traditional method of measuring displacements with a Linear Variable Differential Transformer (LVDT) is used. Both methods were compared in these research project to validate the DIC technique.
The development of the DIC technique has been ongoing since it’s conception in the 80s and has been on a constant change and evolution with the aim of reducing the computational cost and increasing its applicability.
Figure 1 presents a timeline showing the evolution of its implementation. However, starting in 2010 research from (Destrebecq et al., 2011), began its implementation in some civil engineering problems such as: reinforced concrete beams, masonry walls (Mojsilović and Salmanpour, 2016), among others (Bruck et al., 1989; Chu et al., 1985; Pan, 2009; Pan and Li, 2011; Schreier et al., 2009; Schreier et al., 2000; Vendroux and Knauss, 1998).
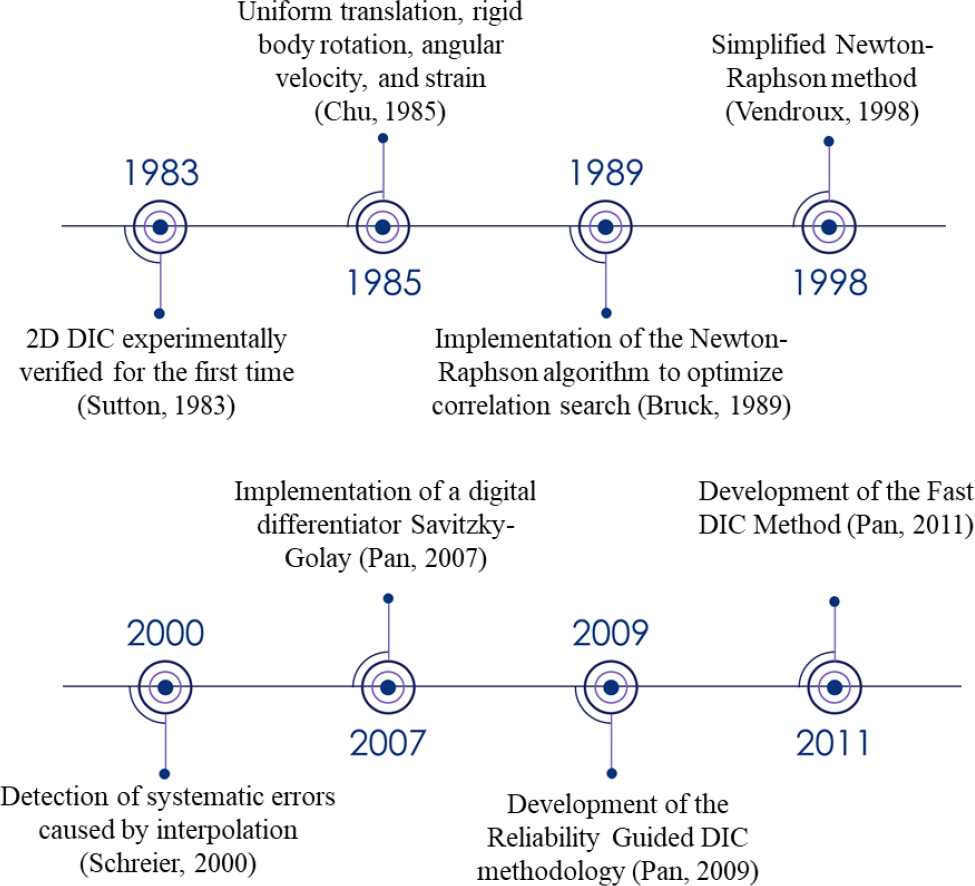
Figure 1. Evolution timeline of the DIC method
1.1 DIC techniques
DIC has different branches that depend on the aim of experimentation, simultaneously, each one can be executed differently using methods that resulted from the evolution of the technique. The established variants of DIC are 2D-DIC, 3D-DIC and DVC which fulfill the task of obtaining 2D deformations, 3D deformations and volumetric deformations respectively (Hubert et al., 2010). The methodologies include factors such as correlation algorithms, ways of surface preparation, interpolation, and calibration methods.
2D-DIC is known as the digital image correlation variant that only requires one camera (Bermudo Gamboa et al., 2019). This is an optical, no contact measuring method that uses the principles of continuum mechanics to extract the displacement fields of an object subjected to a load (Sutton et al., 2008). One of the main advantages of this variant, is the considerable reduction of the implementation time because calibration prior to image capturing is not always needed; decreasing computational power resulting in precisions comparable to the variants of 3D-DIC in strength problems and/or plane deformations (Bermudo Gamboa et al., 2019). However, this presents disadvantages like the inability to detect movements outside the plane and the camera needing to be perpendicular to the object surface (Sutton et al., 2008). In that sense every movement outside of the plane, through rotation or translation, is interpreted as a displacement, this can be theoretically proven with the equation model of the pinhole camera (Sutton et al., 2008).
Stereo DIC or 3D DIC is an established method used for the reconstruction of object shape and for the three-dimensional analysis of the deformation tensor (Zhenxing Hu et al., 2010). For its application, 2 cameras are used to obtain the three-dimensional displacement fields of a physical object. Subsequently, the Stereovision binocular technique is used to recreate a 3D scene from 2 points of view through triangulation (Orteu, 2009). This is possible due to the assumptions that the relative position and orientation of the cameras are known, and that the projection of each camera is synchronized to correspond to the same physical point P of the study object (Orteu, 2009). This 3D variant does not possess the same limitations that the 2D-DIC has, as it can be used to take measurements of objects with multiple geometries and with movements outside the plane. The main disadvantage lies in the application of the technique for both the calibration and correlation algorithms (Bermudo Gamboa et al., 2019).
The Digital Volume Correlation (DVC) is an extension of the 2D-DIC (Jiroušek et al., 2011). DVC takes the concepts of the speckle pattern, image registration, and the correlation of subsets, and it expands the volume to an object of interest (Quintana et al., 2016). The image registration is not done with cameras, rather techniques such as computed tomography, confocal imaging microscope and magnetic resonance imaging are mainly used in biomechanical engineering (Hubert et al., 2010). These methods precede DIC and were typically used to obtain information on material dimension and density, however, with the emergence of DVC this information has a greater potential (Quintana et al., 2016). Instead of using paint as a speckle pattern, like in the 2D-DIC, the image registration is based on the characteristics of the specimen (Quintana et al., 2016). The technique is based on an initial scan with the mentioned image registration methods to obtain the reference volume without deformations. Subsequently, an external force is applied, and sequential scans are carried out consecutively that represent the deformation process of the object (Hubert et al., 2010). Finally, using cubic subsets of voxels, a correlation is carried out to find the u, v and w displacements of the deformed images (Quintana et al., 2016). The advantage to this method is that a complete volume displacement field is obtained, not just of the object surface like in the 2D-DIC and 3D-DIC variants (Jiroušek et al., 2011). The disadvantage is that specialized equipment is required, and the practical applications are more limited to biomechanical microstructures, specifically in mechanics of continuous media (Buljac et al., 2018).
Due to the limitations of the required equipment for the application of DIC, the 2D-DIC variant was used in this investigation, developing an algorithm that obtains the displacement field in image processing.
1.2 Practical applications of DIC in civil engineering
DIC has been applied in different areas of engineering and biomechanics. Regarding civil engineering, it has been mainly applied in problems of structural beams (Sutton et al., 1983), masonry (Allaoui et al., 2018; Mojsilović and Salmanpour, 2016; Zahra et al., 2021; Zahra et al., 2023), and bridges (Dhanasekar et al., 2019; Malesa et al., 2010), among other civil engineering problems. The relevant information on these structures are the deformations and the measuring of the propagation and geometry of cracks. This last one is of great importance in the analysis of the pathologies in the structures.
In the investigation from (Malesa et al., 2010), 2 cameras were employed for the acquisition of images at different points of view of a full-scale bridge in Poland. The methodology involved using a global and local sensor to capture images of the bridge, while a train of 120 Tons passed back and forth repeatedly at 4 distinct speeds. Over 30 experiments were carried out capturing from 20 to 80 images per test. The results of the experiments were compared to a finite element model of the bridge and the results of the DIC coincided sufficiently.
The DIC technique was also applied successfully in reinforced concrete beams. In the investigation done by (Fayyad and Lees, 2014), 2 sets of 7 reinforced concrete beams were prepared, each one was tested three-point bending. A DSLR camera with a resolution of 5472 x 3648 pixels. They used the software Geo PIV, which uses a normalized cross-correlation criterion. They extracted information on crack opening propagation from each specimen. This was compared with a C-Clip gauge, and it was found that the DIC method is effective for visualizing and quantifying fracture properties in the reinforced concrete and for monitoring the cracks in the reinforced concrete beams.
In the investigation by (Mojsilović and Salmanpour, 2016), 10 masonry wallettes were tested using the 2D-DIC method. For image capturing, 2 different cameras were tested: The Nikon D3 with 12.1MP and Nikon D800E with 36.3MP. For each tested specimen, approximately 500 images were taken. The image processing was done using the VIC 2D software, and the correlation criteria was that of normalized square differences. A good relationship was found between the displacements measured by DIC and by LVDTs in both horizontal, diagonal, and vertical directions.
The 2D DIC method was also applied by (Allaoui et al., 2018) to measure the compressive behavior of a prism of 2 rows of brick. The authors employed the correlation software 7D and a commercial camera with a charge-coupled device (CCD). Referring to the DIC, the size of the grids in the mortar joint were defined and optimized to achieve the correct image processing.
Researchers (Howlader et al., 2021) conducted tests on 8 unreinforced masonry perforated walls. The tests were carried out at full scale under cyclic in-plane loading, and constant vertical pre-compression loading. To measure the wall deformations during the tests and to capture complete cracking, they used the 2D DIC method in parallel with traditional LVDT instrumentation. The images were analyzed using VIC-2D software to successfully validate the DIC results against the measurements registered by the LVDTs.
On the other hand, the researchers (Zahra et al., 2021) also applied the 2D-DIC method for determining the deformations in compressive tests of masonry prisms made of hollow concrete blocks. The authors used a monochromatic camera at a speed of 10 frames per second. Later, the DIC results were compared with finite element micro-models.
More recently, (Zahra et al., 2023) applied the DIC technique to obtain the tensile deformation produced in a masonry panel in an out-of-plane bending test. A monochromatic camera was used, allowing the analysis of deformation/tenacity. In this investigation they also used the 2D-DIC method in a lateral panel analysis.
According to the referenced literature, it can be concluded that the DIC method has been applied successfully in different structural problems pertaining to civil engineering. Due to the strength shown by the method in the measuring of the deformation fields and the detection of the beginning and spread of cracks, it was decided to implement this method in on-going research projects. In that sense it was proposed as a goal of this investigation to evaluate the effectiveness of the 2D-DIC method in masonry wallettes fabricated in our laboratory (FIC-UANL) under axial compression loads according to the European standard (Eurocode-6, 2005).
2. METHODOLOGY
The project was carried out by developing the following methodology:
1) Specimen preparation in the laboratory: As part of the project where this research was conducted, three fundamental stages were established: (i) characterization of materials (blocks and mortar) according to the standards (NMX-C-036-ONNCCE-2013, 2013; NMX-C-061-ONNCCE-2015, 2015), (ii) building of the specimens, and (iii) compression testing of the specimens according to European standard (Eurocode-6, 2005).
Seven wallettes of 5 rows of blocks and half-blocks of No.6 were prepared with modular dimensions of 400x150x200mm (Length x width x height). The blocks were acquired from a local Company. The average strength of the blocks was 6.61 MPa (in gross area), and the dimensions of the wallettes were 104 cm in height and 61 cm thick. The wallettes were tested under axial compression as part of a separate unrelated research project being carried out.
2) Preparation of the load frame: The load frame was prepared as shown in Figure 2. An LVDT was placed for measuring the displacements and its subsequent comparison with the results from using the DIC technique.
3) DIC technique preparation: Preparation of the technique consisted of adding a layer of white paint in the center of the specimen, then spraying over with a black spray paint. This created a speckle pattern that was subsequently analyzed through the taking of photographs to obtain the deformed image as the test went on (see Figure 3). Figure 3A shows 4 wallettes prepared with the camera settings F5 with ISO 500 and a shutter speed of 1/13 s. In Figure 3B, the other 3 wallettes are presented with the camera settings F5 with ISO 250 and a shutter speed of 1/25 s. Additionally, control points were used in each test for subsequent error calculation due to any potential movements of the camera support from the load frame. The control points are shown in Figure 3C.
4) Image capture: For image capturing the NIKON D5600 camera with lenses from 18mm to 58mm of 24 MPX with remote control and a Manfrotto tripod were used. Additionally, two GTC cold light sources of 3900 lm with photographic umbrella were employed, as shown in Figure 4. The image capturing took place during the wallettes testing.
5) DIC algorithm: For the application of the DIC technique, an algorithm was developed in the Python programming language. In (Valencia-Guzmán, 2021) the algorithm script can be consulted. For its development, different methods and recommendations from previous research (Su et al., 2019) were used. For the algorithm, the flowchart presented in Figure 5 and the methodology explained in Figure 6 were followed.
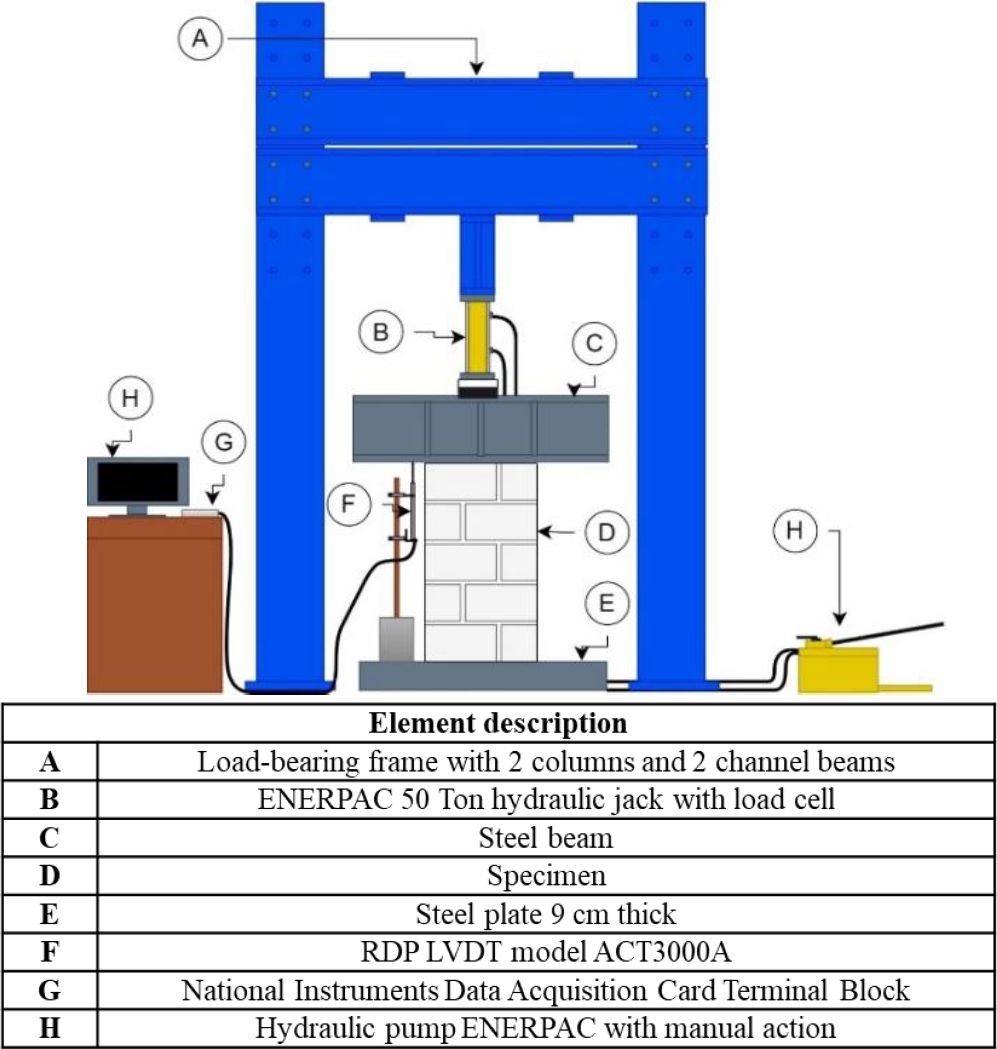
Figure 2. Scheme of the loading frame for the specimen test.
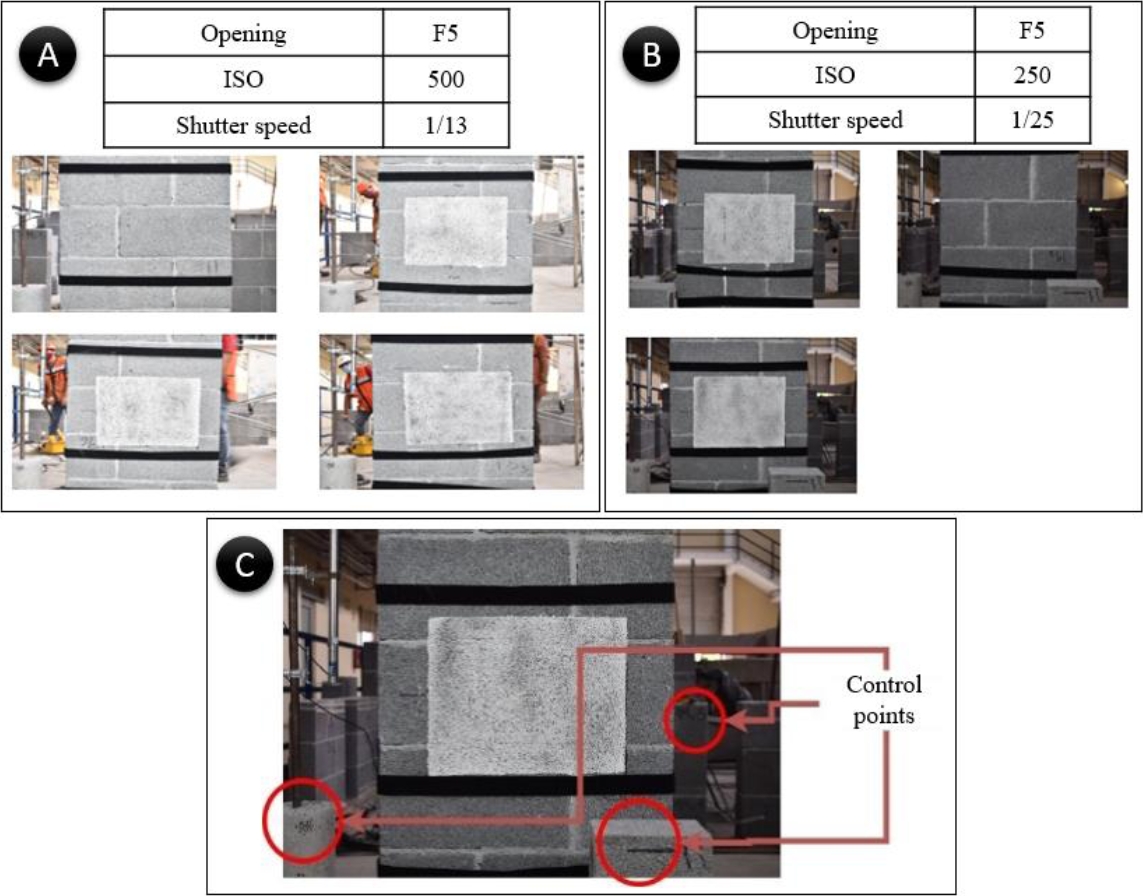
Figure 3. Preparing the DIC technique. A) Wallettes photographed using the following camera settings: ISO 500, shutter speed is 1/13 s, and the aperture is F5. B) Wallettes, photographed using the following camera settings: ISO 250, shutter speed is 1/25 s, and the aperture is F5. C) Control points used for the experiment.
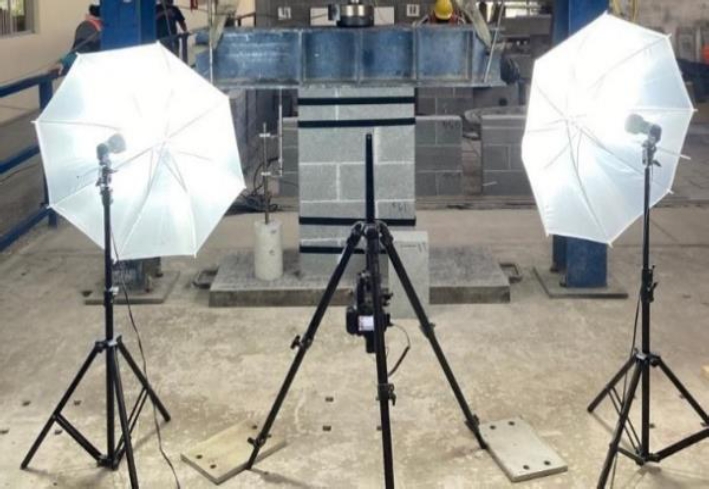
Figure 4. Wallette setup, camera positioning, and light array used for capturing the images.
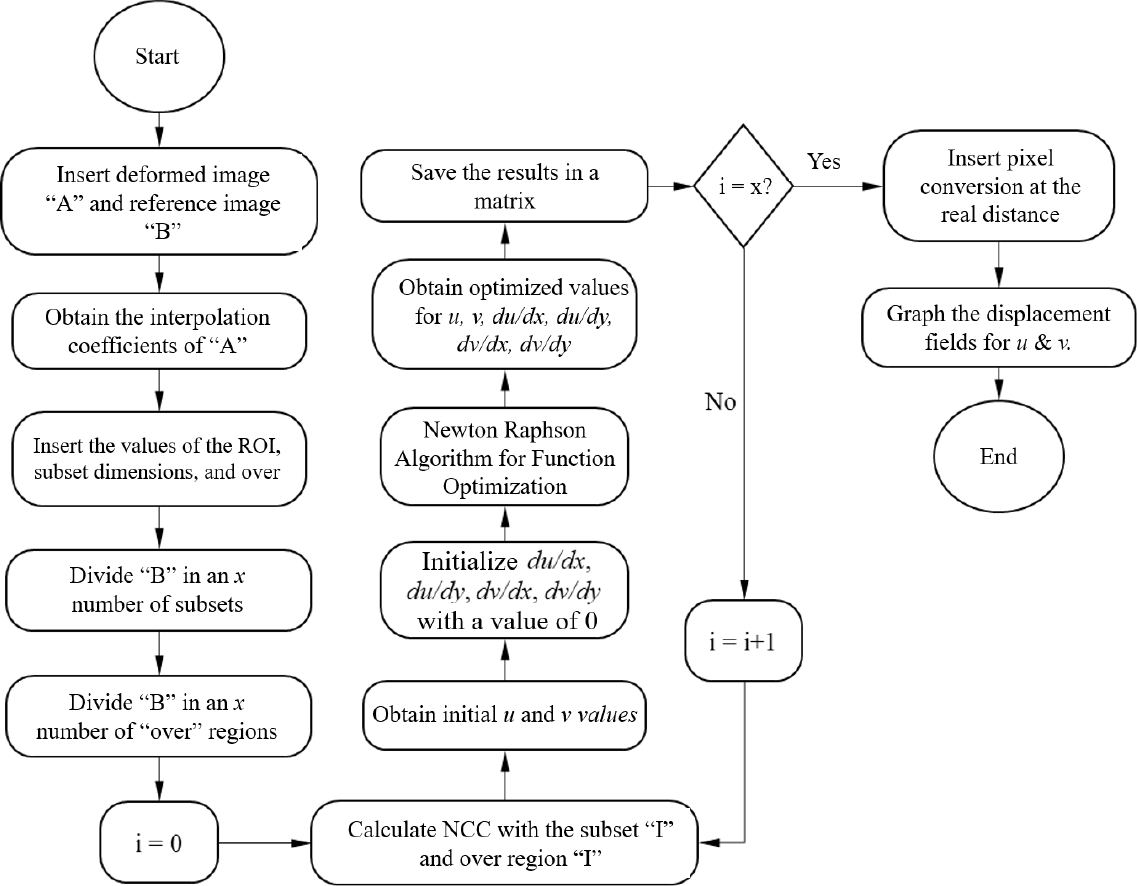
Figure 5. Flow chart of the algorithm developed for the DIC technique application (Valencia-Guzmán, 2021)
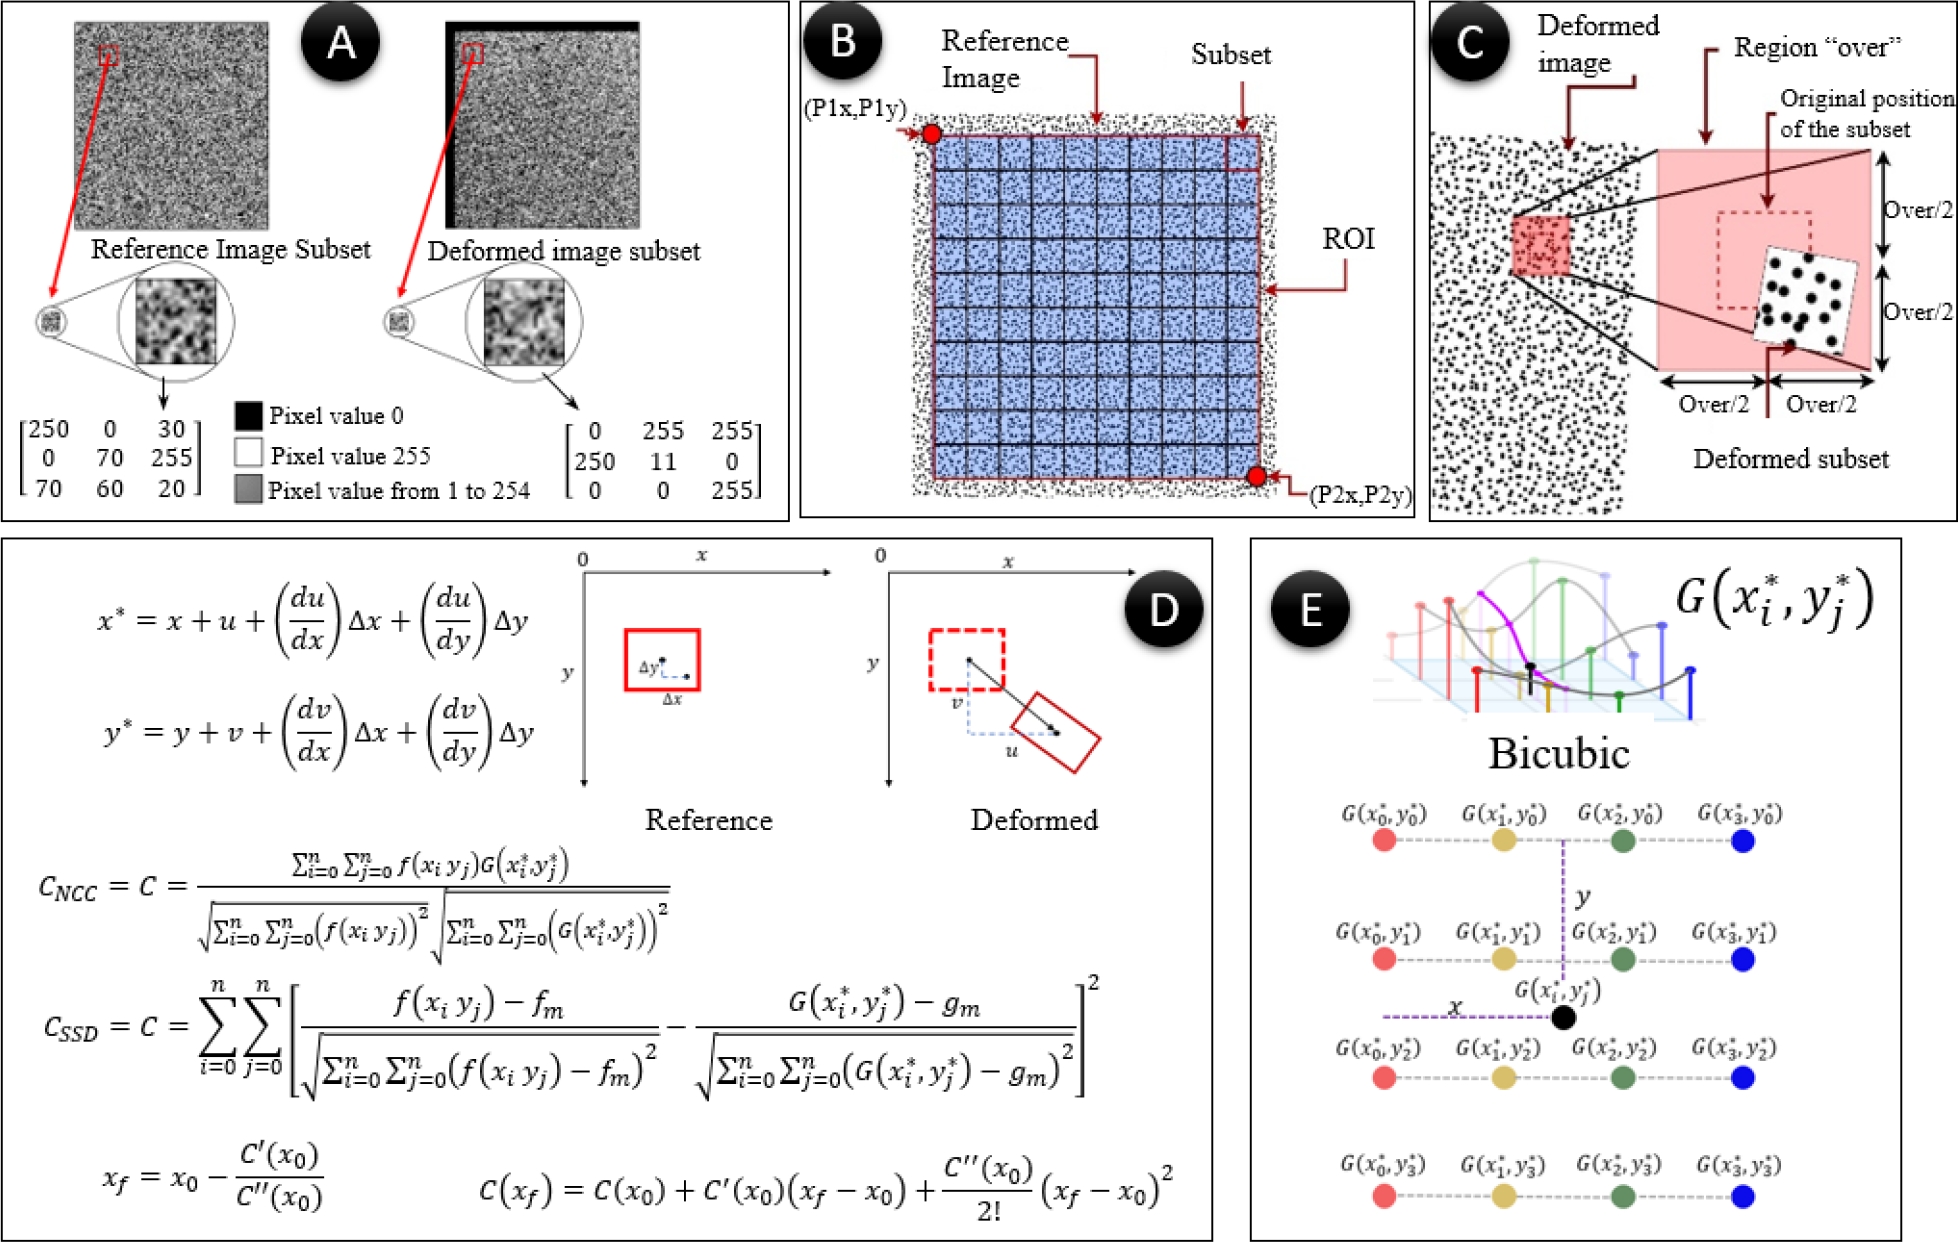
Figure 6. Methodology followed for the algorithm implementation (Valencia-Guzmán, 2021)
Figure 6 shows the methodology for implementing the algorithm used for applying the DIC technique. Firstly, a subset of the speckle pattern was obtained in the reference image and the same subset in the deformed image taken during the test (Figure 6A). The subsets were classified into pixels from the following grayscale: 0 (black) to 255 (white). Subsequently, the subsets were optimally subdivided, selecting the "Region Of Interest" (ROI) (Figure 6B). Once the subsets are defined inside the ROI, the search position inside the deformed image is determined. This is accomplished by defining an arbitrary “over” distance, which depends on the maximum estimated deformations (Figure 6C). The equations used to determine the coordinates of the deformed points are presented in Figure 6D, starting with the horizontal (u) and vertical (v) displacements. In addition, the interpolation functions were used for the non-deformed state and the deformed state . For the calculation of the correlation coefficients, the Normalized Cross-Correlation and Sum of Squared Differences ( criteria were applied (Pan et al., 2010). The search for the extreme correlation values is done using the Newton Raphson method (Steven and Raymond, 2015). To obtain the interpolation functions f’, ‘G’ and ‘C’, the bicubic interpolation criterion was employed (Figure 6E), due to the computational demand that is relatively low compared to other interpolation methods (Schreier et al., 2000).
3. RESULTS AND DISCUSSION
The proposed algorithm was verified using a synthetic image in the open-source software Speckle Generator. The maximum relative error in terms of the displacement field values (u, v, α) in the algorithm verification was 0.053% for the horizontal displacement, u. This was taken inside a determined subset under ideal conditions, meaning there were no distortions and there were no undesired movements present (see Table 1).
Table 1. Errors in translations and rotation
| Variables | Estimated value | Obtained value | Relative error |
| u | 32.897 px | 32.9144 px | 0.053% |
| v | -36.5146 px | -36.497 px | 0.048% |
| α | 0.0523599 rad | 0.0521625 rad | 0.378% |
After verifying the algorithm, the load vs. displacement graphs were obtained for each test conducted in intervals from previously selected loads (see Figure 7 and 8). Taking into consideration that the LVDT only registers linear vertical displacement in the line segment () and the DIC technique uses in between 1000 and 4000 points depending on the wallette surface referenced, an average of vertical displacements along the line () at the center of the reference surface was obtained for comparison between the DIC and LVDT results (see Figure 9).
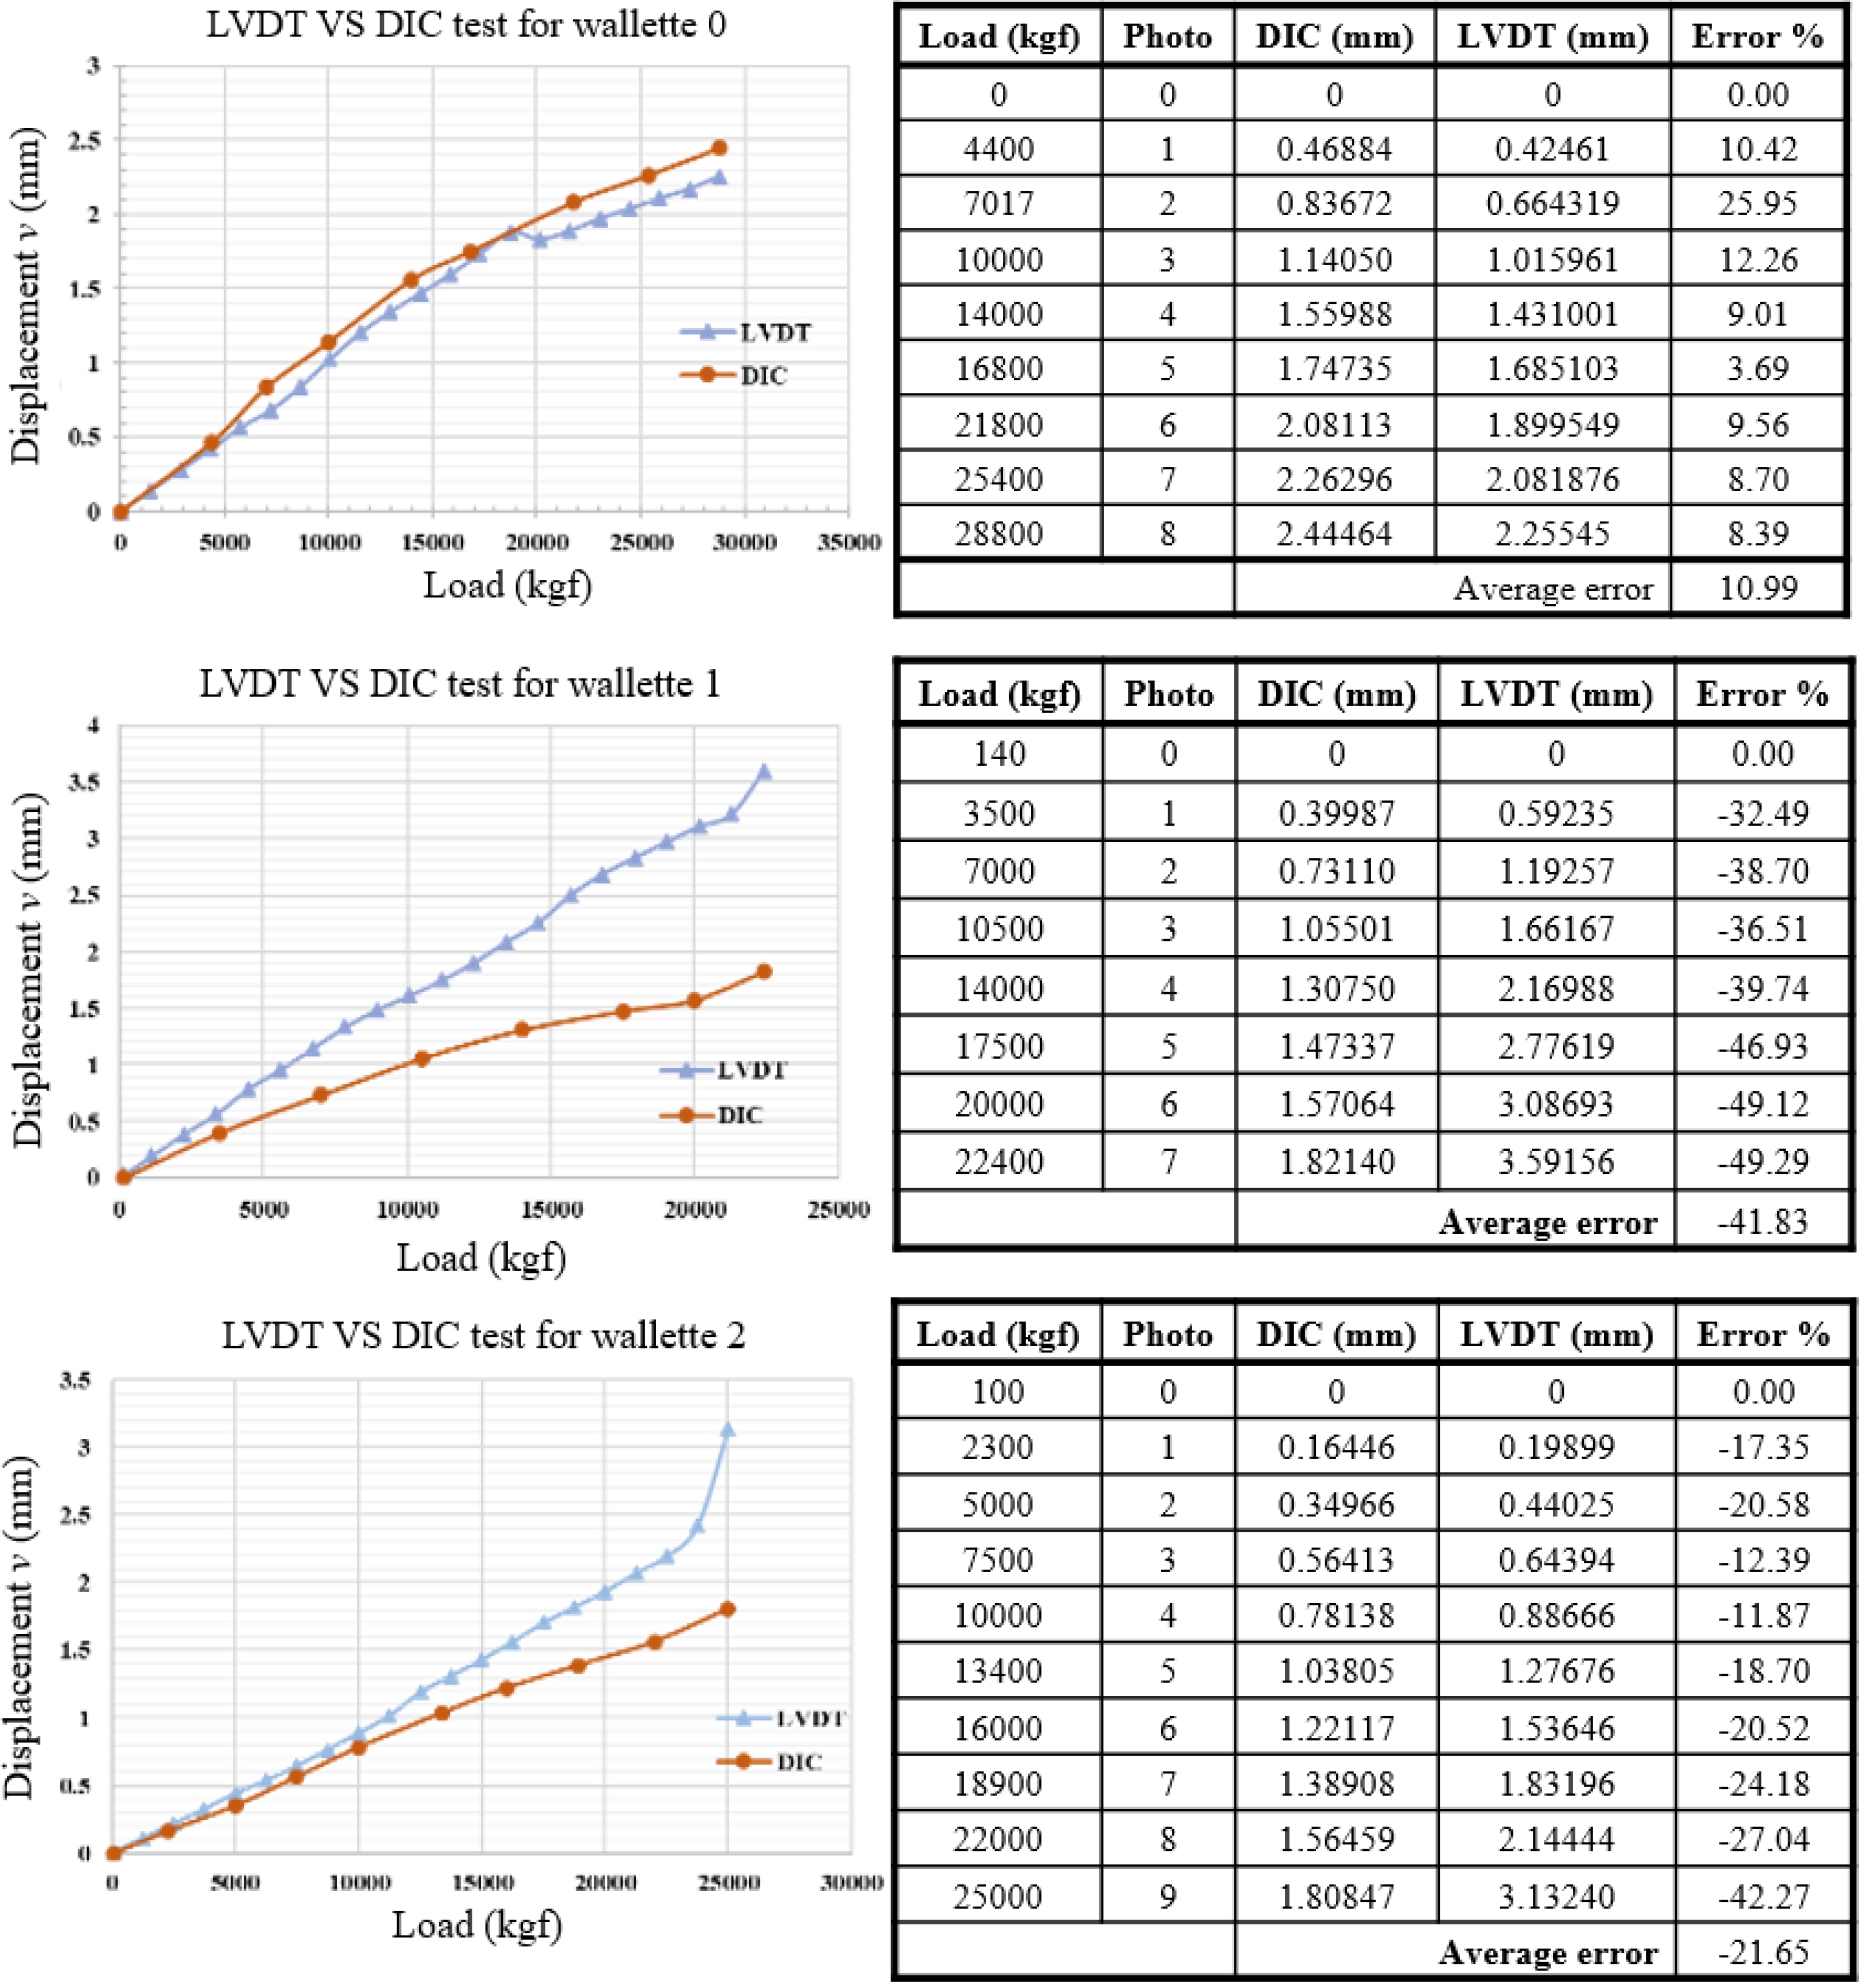
Figure 7. Results of the comparison between the LVDT and the DIC for wallettes 0, 1 and 2.
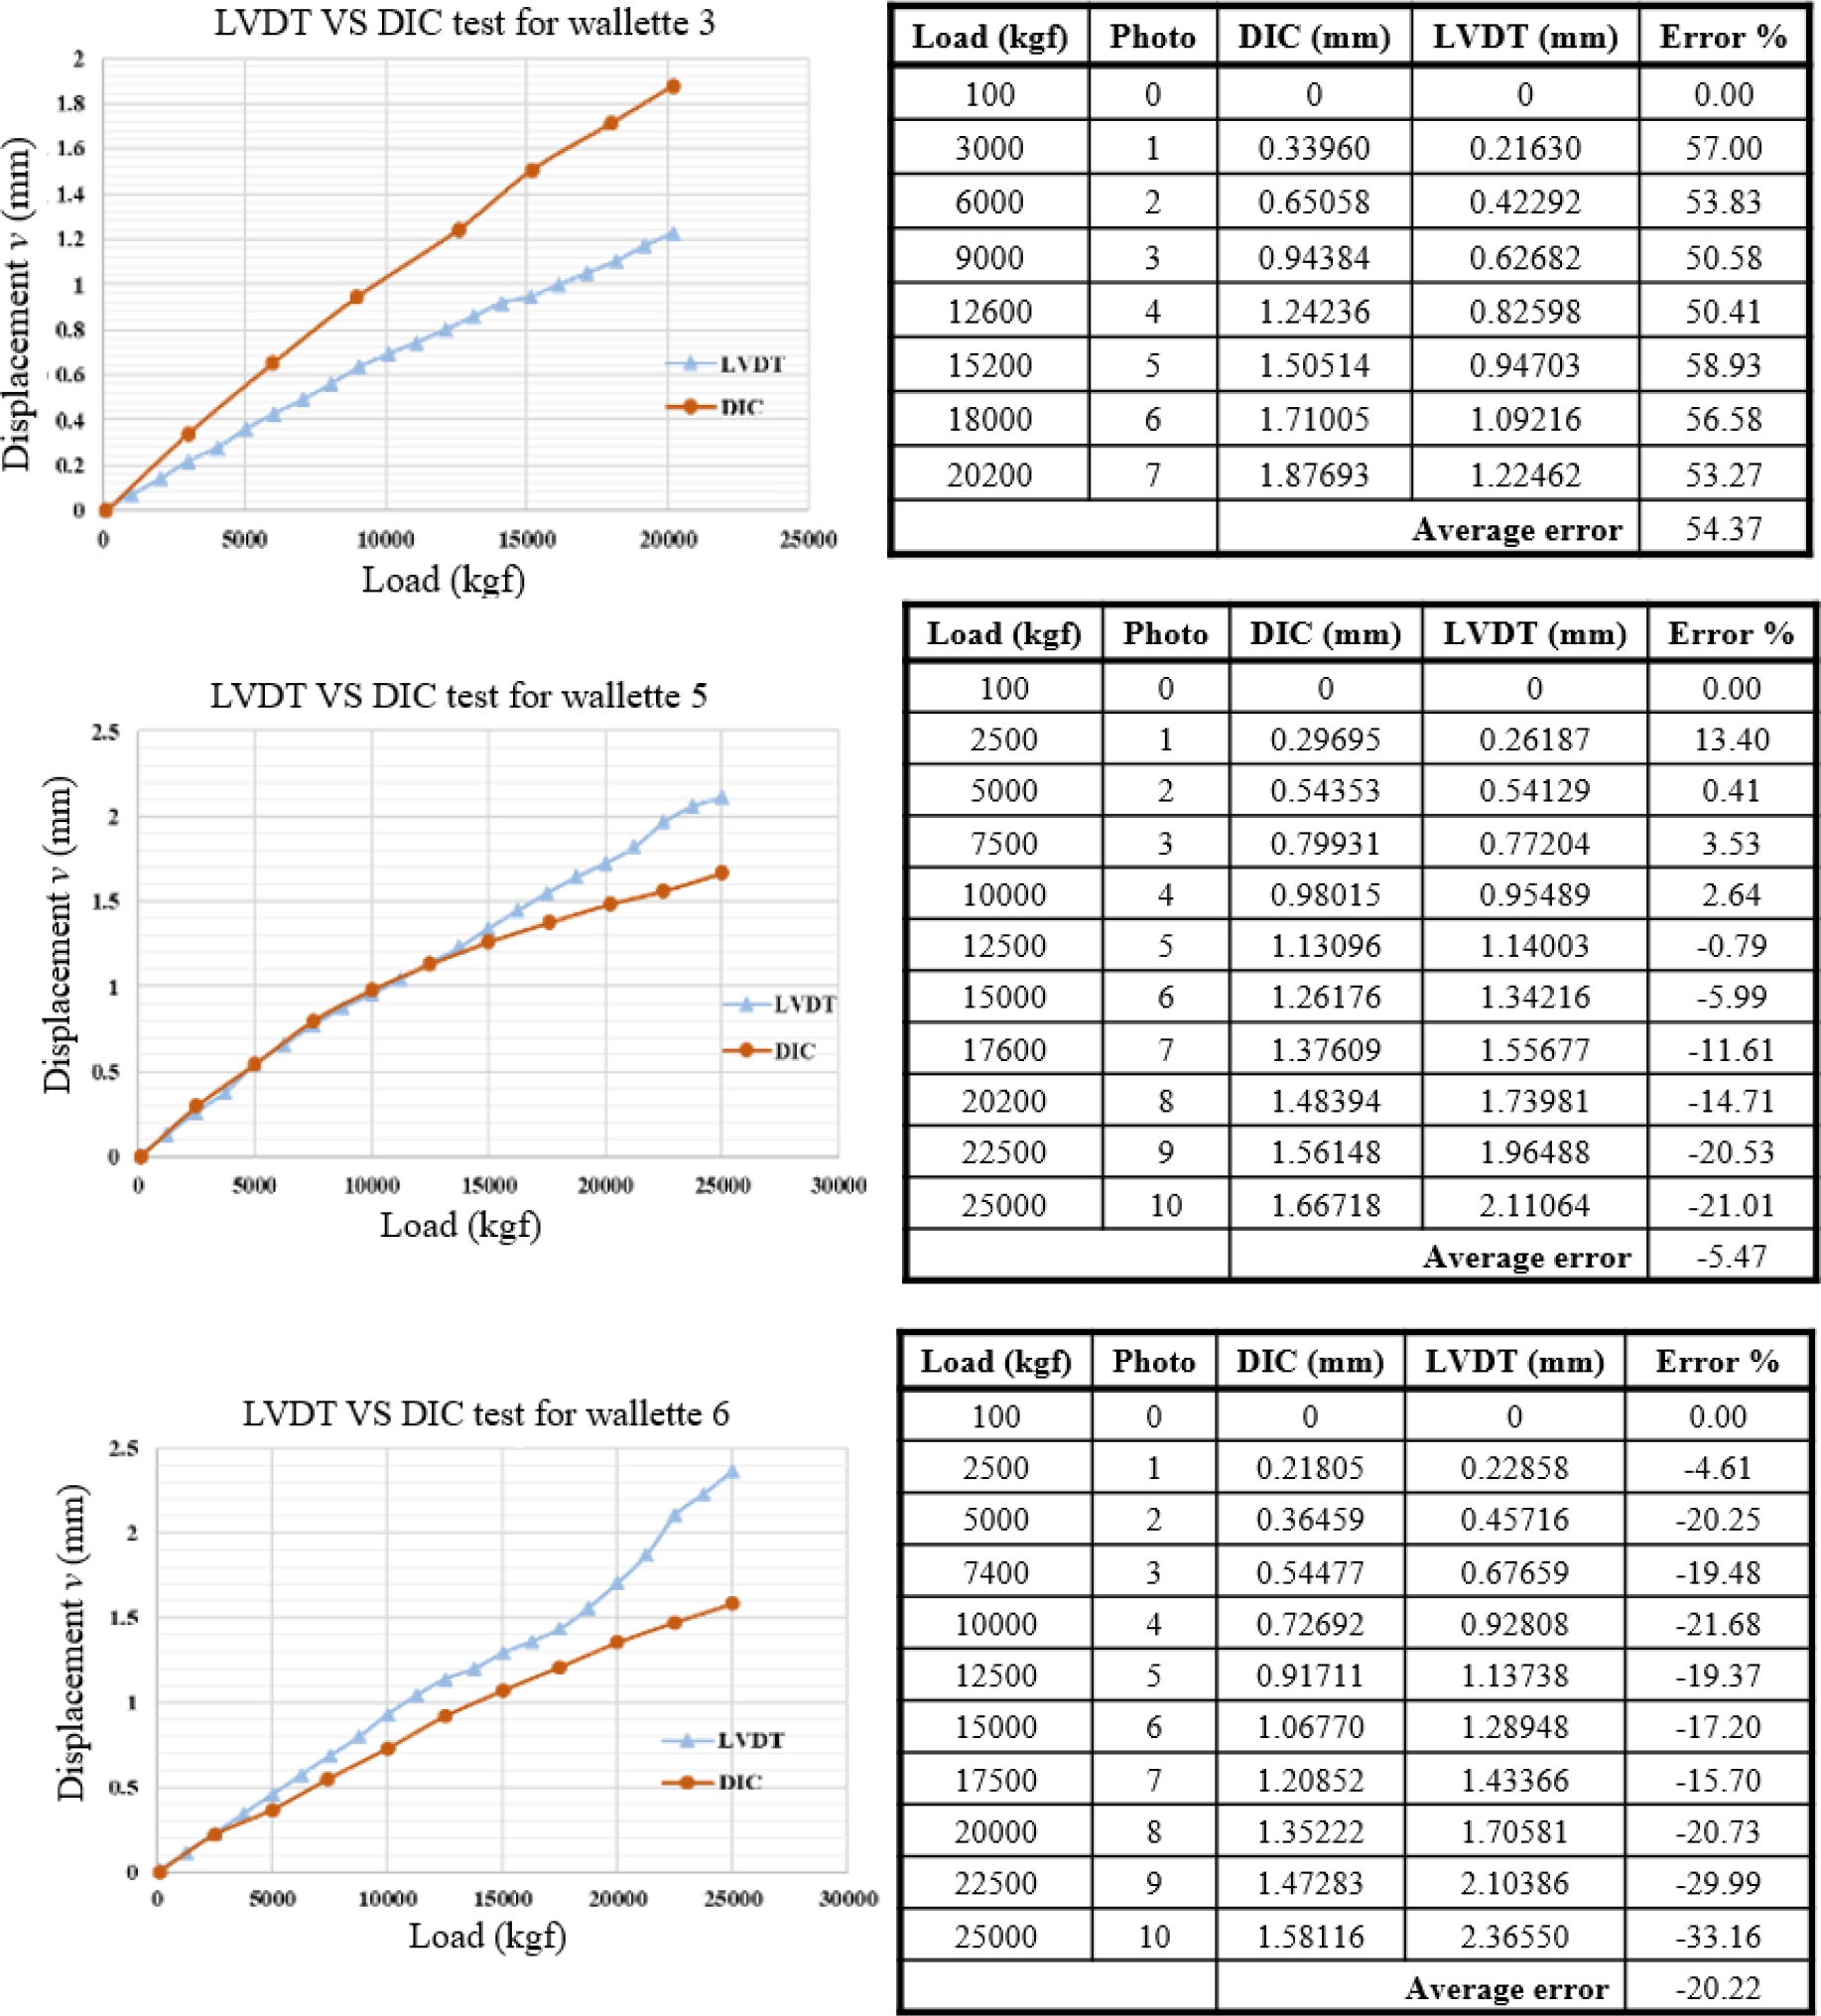
Figure 8. Results of the comparison between the LVDT and the DIC for wallettes 3, 5 and 6.
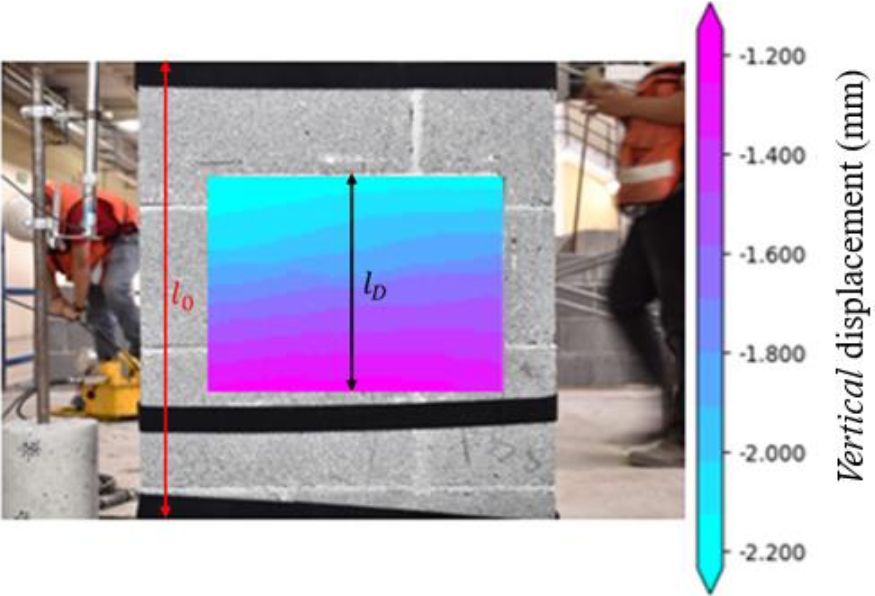
Figure 9. Results of the vertical displacements obtained using the algorithm employed in the DIC for the test of 5th wallette with a maximum load of 25,000 kgf.
From the tests conducted on the 7 wallettes samples, it was not possible to obtain the LVDT information from the 4th specimen. The results for the wallettes tested are shown in Figures 7 and 8, denominated as tests 0, 1, 2, 3, 4, 5, and 6. Additionally, the calculated relative error rates in between the displacement values obtained from the LVDT measures and the ones obtained from the DIC technique are shown.
A maximum absolute difference of 1.77 mm was found from testing wallette number 1 (Figure 7), and an average maximum relative error of 54.37% was found from wallete number 3 (Figure 8). These errors are significant and can be attributed to the following reasons:
(1) Undesired movements of the plate and tripod.
(2) While testing wallette #3, there was evidence of the appearance and propagation of a crack, which resulted in irregular values and distorted subsets.
(3) Lens distortion.
Through the control points shown in Figure 3, it was verified that there were no significant movements of the tripod. Lower error averages of 10.99%, 21.65%, 5.47%, and 20.22% were found in the wallettes tested from 0, 2, 5, and 6 respectively. Nonetheless it is still important to note that these errors still surpassed the desired precision values, especially in the tests where the loads exceeded 15000 kgf (15 t) where major differences were registered.
In Figure 9, the reference results for the vertical displacements of the test of wallette #5 are shown in the photograph taken before the failure, with a maximum load of 25000 kgf. These displacements were obtained throughout the measured domain applying the DIC technique.
In the study from (Zahra et al., 2021), compression tests were carried out on prisms with hollow concrete blocks of similar qualities to the ones in the present investigation. The results were presented in terms of the strain, by using the technique from the 2D-DIC method. A comparison in terms of the maximum vertical average displacements in axial compression is presented in Table 2. It can be observed that the relative error rates remained around 21%, taking on the pattern value presented in the investigation by (Zahra et al., 2021). These differences can be attributed to the variations that exist in between the two investigations, for example the form of the specimens (prisms vs wallettes). However, the results obtained were encouraging and motivate the continued use of this technique in our future research line.
Table 2. Comparison of the results obtained with previous studies
| Reference | Maximum vertical strain in compression | Maximum vertical average displacements in compression |
| (Zahra et al., 2021) | 0.007 mm/mm | 2.8 mm |
| This research, vertical displacements before failure | - | 2.2 mm |
| Relative error | 21% | |
4. CONCLUSIONS
The proposed algorithm was verified by using a synthetic image produced by the free software Speckle Generator. The maximum relative error obtained in the displacement field was 0.053% for the horizontal displacement.
It was found that when comparing the vertical displacements in between the DIC results and the LVDT devices, large relative error rates were found with an average maximum of 54.37% in the 3rd Wallette test. This was due to factors like: the optical distortion of the lens, undesired movements, and the appearance of cracks and discontinuities in the medium.
The factors necessary for calibration for the desired precision were identified with the implemented methodology.
This research started with the implementation of the process for the DIC technique, and it can serve as a basis for future investigations and experiments.
5. ACKNOWLEDGEMENTS
The authors would like to express their gratitude to the Structural Department of Structural Engineering and Assessment of the Institute of Civil Engineering at the FIC, UANL, and to the PAICYT program: 595-IT-2022, 496-IT-2022, and 598-IT-2022
6. REFERENCES
Allaoui, S., Rekik, A., Gasser, A., Blond, E., Andreev, K. (2018). Digital Image Correlation measurements of mortarless joint closure in refractory masonries. Construction and Building Materials, 162, 334-344. https://doi.org/https://doi.org/10.1016/j.conbuildmat.2017.12.055
Bermudo Gamboa, C., Martín-Béjar, S., Trujillo Vilches, F. J., Castillo López, G., Sevilla Hurtado, L. (2019). 2D-3D Digital Image Correlation Comparative Analysis for Indentation Process. Materials, 12(24).
Bruck, H. A., McNeill, S. R., Sutton, M. A., Peters, W. H. (1989). Digital image correlation using Newton-Raphson method of partial differential correction. Experimental Mechanics, 29(3), 261-267. https://doi.org/10.1007/BF02321405
Buljac, A., Jailin, C., Mendoza, A., Neggers, J., Taillandier-Thomas, T., Bouterf, A., Smaniotto, B., Hild, F., Roux, S. (2018). Digital Volume Correlation: Review of Progress and Challenges. Experimental Mechanics, 58(5), 661-708. https://doi.org/10.1007/s11340-018-0390-7
Chu, T. C., Ranson, W. F., Sutton, M. A. (1985). Applications of digital-image-correlation techniques to experimental mechanics. Experimental Mechanics, 25(3), 232-244. https://doi.org/10.1007/BF02325092
Destrebecq, J. F., Toussaint, E., Ferrier, E. (2011). Analysis of Cracks and Deformations in a Full Scale Reinforced Concrete Beam Using a Digital Image Correlation Technique. Experimental Mechanics, 51(6), 879-890. https://doi.org/10.1007/s11340-010-9384-9
Dhanasekar, M., Prasad, P., Dorji, J., Zahra, T. (2019). Serviceability Assessment of Masonry Arch Bridges Using Digital Image Correlation. Journal of Bridge Engineering, 24(2), 04018120. https://doi.org/10.1061/(ASCE)BE.1943-5592.0001341
Eurocode-6. (2005). Design of masonry structures. In Part 1-1: General rules for reinforced and unreinforced masonry structures.
Fayyad, T. M., Lees, J. M. (2014). Application of Digital Image Correlation to Reinforced Concrete Fracture. Procedia Materials Science, 3, 1585-1590. https://doi.org/https://doi.org/10.1016/j.mspro.2014.06.256
Howlader, M. K., Masia, M. J., Griffith, M. C. (2021). Digital image correlation for the analysis of in-plane tested unreinforced masonry walls. Structures, 29, 427-445. https://doi.org/https://doi.org/10.1016/j.istruc.2020.11.051
Hubert, S., Jean-José, O., Sutton., M. A. (2010). Image Correlation for Shape, Motion and Deformation Measurements. https://doi.org/https://doi.org/10.1007/978-0-387-78747-3
Jiroušek, O., Jandejsek, I., Vavřík, D. (2011). Evaluation of strain field in microstructures using micro-CT and digital volume correlation. Journal of Instrumentation, 6(01), C01039. https://doi.org/10.1088/1748-0221/6/01/C01039
Malesa, M., Szczepanek, D., Kujawińska, M., Świercz, A., Kołakowski, P. (2010). Monitoring of civil engineering structures using Digital Image Correlation technique. EPJ Web of Conferences, 6. https://doi.org/https://doi.org/10.1051/epjconf/20100631014
Mojsilović, N., Salmanpour, A. H. (2016). Masonry walls subjected to in-plane cyclic loading: application of digital image correlation for deformation field measurement. International Journal of Masonry Research and Innovation, 1(2), 165-187. https://doi.org/10.1504/IJMRI.2016.077473
NMX-C-036-ONNCCE-2013. (2013). Resistencia a la compresión de bloques, tabiques o ladrillos y tabicones y adoquines. In (pp. 10).
NMX-C-061-ONNCCE-2015. (2015). Determinación de la resistencia a la compresión de cementantes hidráulicos. In (pp. 12).
Orteu, J.-J. (2009). 3-D computer vision in experimental mechanics. Optics and Lasers in Engineering, 47(3), 282-291. https://doi.org/https://doi.org/10.1016/j.optlaseng.2007.11.009
Pan, B. (2009). Reliability-guided digital image correlation for image deformation measurement. Applied Optics, 48(8), 1535-1542. https://doi.org/10.1364/AO.48.001535
Pan, B., Li, K. (2011). A fast digital image correlation method for deformation measurement. Optics and Lasers in Engineering, 49(7), 841-847. https://doi.org/https://doi.org/10.1016/j.optlaseng.2011.02.023
Pan, B., Xie, H., Wang, Z. (2010). Equivalence of digital image correlation criteria for pattern matching. Applied Optics, 49(28), 5501-5509. https://doi.org/10.1364/AO.49.005501
Quintana, K. T., Reu, P., Jimenez, E., Kramer, S. (2016). Digital Volume Correlation for Materials Characterization 19th World Conference on Non-Destructive Testing,
Schreier, H., Orteu, J.-J., Sutton, M. A. (2009). Image Correlation for Shape, Motion and Deformation Measurements. Basic Concepts,Theory and Applications (1 ed.). Springer New York, NY. https://doi.org/https://doi.org/10.1007/978-0-387-78747-3
Schreier, H. W., Braasch, J. R., Sutton, M. A. (2000). Systematic errors in digital image correlation caused by intensity interpolation. Optical Engineering, 39, 2915-2921.
Steven, C. C., Raymond, P. C. (2015). Métodos numéricos para ingenieros.
Su, Y., Zhang, Q., Fang, Z., Wang, Y., Liu, Y., Wu, S. (2019). Elimination of systematic error in digital image correlation caused by intensity interpolation by introducing position randomness to subset points. Optics and Lasers in Engineering, 114, 60-75. https://doi.org/https://doi.org/10.1016/j.optlaseng.2018.10.012
Sutton, M. A., Wolters, W. J., Peters, W. H., Ranson, W. F., McNeill, S. R. (1983). Determination of displacements using an improved digital correlation method. Image and Vision Computing, 1(3), 133-139. https://doi.org/https://doi.org/10.1016/0262-8856(83)90064-1
Sutton, M. A., Yan, J. H., Tiwari, V., Schreier, H. W., Orteu, J. J. (2008). The effect of out-of-plane motion on 2D and 3D digital image correlation measurements. Optics and Lasers in Engineering, 46(10), 746-757. https://doi.org/https://doi.org/10.1016/j.optlaseng.2008.05.005
Valencia-Guzmán, E. (2021). Aplicación de correlación de imagen digital en muretes fabricados en laboratorio Universidad Autónoma de Nuevo León].
Vendroux, G., Knauss, W. G. (1998). Submicron deformation field measurements: Part 2. Improved digital image correlation. Experimental Mechanics, 38(2), 86-92. https://doi.org/10.1007/BF02321649
Zahra, T., Thamboo, J., Asad, M. (2021). Compressive strength and deformation characteristics of concrete block masonry made with different mortars, blocks and mortar beddings types. Journal of Building Engineering, 38, 102213. https://doi.org/https://doi.org/10.1016/j.jobe.2021.102213
Zahra, T., Thamboo, J., Dorji, J., Asad, M., Kasinski, W., Nardone, A. (2023). Out-of-plane flexural behaviour of reinforced mortarless concrete block masonry: An experimental study. Construction and Building Materials, 384, 131448. https://doi.org/https://doi.org/10.1016/j.conbuildmat.2023.131448
Zhenxing, Hu, Huimin, Xie, Jian, Lu, Tao, Hua, Jianguo, Zhu. (2010). Study of the performance of different subpixel image correlation methods in 3D digital image correlation. Applied Optics, 49(21), 4044-4051. https://doi.org/10.1364/AO.49.004044