
| Study Case | https://doi.org/10.21041/ra.v11i3.538 |
Mapping External Mortar Render (EMR) defects: case study in multi-storey residential buildings
Mapeamento de manifestações patológicas em revestimentos argamassados de fachada (RAF): estudo de caso em edifícios residenciais
Mapeo de manifestaciones patológicas en revestimientos de mortero (RAF): un estudio de caso en edificios residenciales
R.
Dias1
*
![]() , L. Pagoto1
, L. Pagoto1
![]() , N. Tsutsumoto2
, N. Tsutsumoto2
![]() , C. Fioriti3
, C. Fioriti3
![]()
1 Departamento de Engenharia Civil, Faculdade de Engenharia de Ilha Solteira - FEIS/UNESP, Universidade Estadual Paulista, Ilha Solteira, Brasil.
2 Instituto Federal de Educação, Ciência e Tecnologia de São Paulo, Campus Avançado Ilha Solteira, SP, Brasil.
3 Universidade Estadual Paulista, Faculdade de Ciências e Tecnologia - FCT/UNESP, Presidente Prudente, Brasil.
*Contact author: rdias07@live.com
Reception: May 18, 2021.
Acceptance: July 09, 2021.
Publication: September 01, 2021.
| Cite as: Dias, R., Pagoto, L., Tsutsumoto, N., Fioriti, C. (2021), "Mapping External Mortar Render (EMR) defects: case study in multi-storey residential buildings", Revista ALCONPAT, 11 (3), pp. 88 – 107, DOI: https://doi.org/10.21041/ra.v11i3.538 |
Abstract
This study aims to identify, map, and quantify the external mortar render (EMR) defects of 22 multi-storey buildings located in the Fernandópolis city, Brazil. Incidence (M-INC) and intensity (M-INT) methods were used to quantify the building defect (BD) of five typified facade regions: continuous wall (1-OCW), around openings (2-OOP), top of parapets and eaves (3-TOP), below balconies, soffits or ledges (4-BCE), and on corners and edges (5-OCE). In addition, three degradation pattern maps were created. We observed 4351 and 481 BDs by M-INT and M-INC, respectively. The most frequent problems were stains and cracks. The most affected regions by M-INT were 2-OOP (34.5%), 1-OCW (23.3%), and 4-BCP (21.6%) while by M-INC were 1-OCW (39.9%), 3- TOP (29.3%), and 2-OOP (16.6%).
Keywords:
mortar renders,
anomalies,
degradation,
building pathology,
mapping defect.
Resumo
Este trabalho objetivou identificar, mapear e quantificar as manifestações patológicas (MP) em revestimentos argamassados de fachada (EMR), de 22 prédios residenciais de Fernandópolis-SP, Brasil. Para quantificação das MPs foram empregados os métodos da incidência (M-INC) e intensidade (M-INT), considerando a localização em cinco regiões tipificadas da fachada: paredes contínuas (1-OCW), entorno de aberturas (2-OOP), topo de parapeitos e beirais (3-TOP), abaixo de varandas/sacadas/ressaltos (4-BCP) e cantos/bordos (5-OCE). Observou-se 4351 e 481 BDs pelo M-INT e M-INC, respectivamente, realizando três mapas padrão de degradação. As BDs mais frequentes foram as manchas e fissuras. As regiões mais afetadas pelo M-INT foram 2-OOP (34,5%), 1-OCW (23,3%), e 4-BCP (21,60%), enquanto para o M-INC foram 1-OCW (39,9%), 3-TOP (29,3%) e 2-OOP (16,6%).
Palavras-chave:
revestimentos de argamassa,
anomalias,
degradação,
patologia das edificações,
mapeamento.
Resumen
Este trabajo tuvo como objetivo identificar, mapear y cuantificar las manifestaciones patológicas (BD) en revestimientos de fachadas de mortero (EMR) de 22 edificios residenciales en Fernandópolis-SP, Brasil. Para cuantificar las BDs se utilizaron los métodos de incidencia (M-INC) e intensidad (M-INT), considerando cinco regiones tipificadas de la fachada: muros continuos (1-OCW), alrededor de huecos (2-OOP), parte superior de parapetos y aleros (3-TOP), debajo de balcones/balcones/voladizos (4-BCP) y esquinas/bordes (5-OCE). Se observaron 4351 y 481 BDs por M-INT y M-INC, respectivamente, realizando mapas estándar de degradación. Los BD más frecuentes fueron manchas y grietas. Las regiones más afectadas por M-INT fueron 2-OOP (34,5%), 1-OCW (23,3%) y 4-BCP (21,60%), y para M-INC fueron 1- OCW (39,9%), 3 -TOP (29,3%) y 2-OOP (16,6%).
Palabras clave:
recubrimientos de mortero,
anomalías,
degradación,
patología de la edificación,
mapeo de defectos.
1. Introduction
Walls and their renders affect the habitability and healthiness of buildings; therefore, they must meet the minimum requirements for performance and useful life (Terra, 2001; Silva et al., 2013). The anomalies found in mortar facade render (EMR) have various origins, and the presence of a building defect (BD) decreases the functional performance of EMR, thus causing damage to users (Bauer, 2017; Dorfman; Petrucci, 1989).
The facades of the buildings perform differently depending on their geographic orientation. This difference is because of the climatic action (wind, solar charge, and rain) that affects a facade (Fox et al., 2016). However, anomalies owing to thermal in the EMR can be observed for facades that are not directly exposed to solar irradiation (without direct heat flow): they are normally identified in humid places with cracks and/or coating (Takeda; Maker, 2018).
There are various failures that affect EMR, which can originate in different phases of a building triggered either by human error (design strategies, construction, use, and maintenance) or climatic effects (Bauer, 2017; Bauer et al., 2018). The variation in climatic effects affects the durability of the EMR owing to its constant interaction. For temperature, the seasonal and/or daily variations could generate internal stresses in the mortar that could culminate in the gradual formation of microcracks, thus decreasing the performance of the coating and a consequent reduction in useful life (Sentena et al, 2018).
Solar radiation mainly affects the horizontal surfaces and facades of a building; however, many architects and urban planners have dispended significant attention to designing options, thus neglecting thermo-physical performance (Fabbri et al., 2020).
The various factors that affect the durability of buildings and their subsystems, such as EMR, can be subdivided into two categories. The first is related to the durability of the system and the second is related to the aggressiveness of the environment (Souza et al., 2018). Thus, external rendering construction systems need to be evaluated, specifically in different climatic zones (Maciel; Carvalho, 2019).
Considering the distinction of actions according to the geographic location of a building, the mapping of degradation and any other type of anomaly (BD) is crucial in the construction of a database between a laboratory and field, to transform data of research into useful practical notions that will become inducers of appropriate conservation actions (Rodrigues, 2014).
Using the data collected, connections between different parts of a facade and the types of defects that occured in the mortar lining were established. These links can be expressed graphically through "degradation pattern maps’ (Gaspar; Brito, 2005).
Owing to the significance of EMR for buildings, it is necessary to study the BDs that will contribute to the degradation during useful life, which could be minimized when planned during the design or execution of the render (Postingher et al., 2019).
In recent years, various studies have been carried out to develop and/or improve methods for predicting the useful life of buildings and/or their systems, as well as to provide techniques for the prevention, diagnosis, and rehabilitation of buildings (Flores-Colen; Brito, 2010; Silva et al., 2013; Vieira et al., 2015; Silva et al., 2011; Carvalho et al., 2016; Silva et al., 2018; Charisi et al., 2018; Souza et al., 2018; Ferreira et al., 2019; Ansah et al., 2020; Saviz et al., 2020).
In these studies, several variables of the developed methods relate to the BD observed in buildings of a certain location or region. However, the lack of knowledge of the professionals of the productive chain owing to the absence of concise data on the origin of the pathological problems, which are the most common forms of manifestation, as well as the lack of registration and dissemination of data delay the development and improvement of the techniques of designing and building, and preventing previous errors (Thomaz, 2020).
Thus, this study aims to identify, map, and quantify the main BDs that affect 22 multi-story residential buildings in the municipality of Fernandópolis-SP, Brazil, by inspecting buildings that meet the established criteria.
2. Procedures
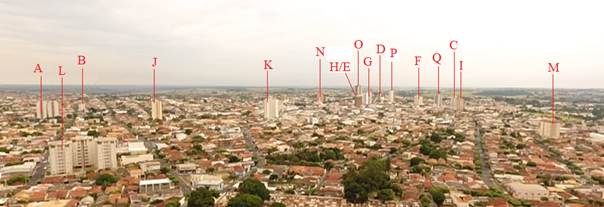
Fernandópolis city, Brazil, is a small municipality located in the northwestern region of the state of São Paulo. The municipality is relatively new, approximately 82 years old (Prefeitura De Fernandópolis, 2012). Therefore, the multi-story buildings in the municipality are more recent than their age and with maximum ages varying between 4 and 34 years. Thus, the case study was carried out in all residential buildings above five floors in the municipality of Fernandópolis-SP.
The sample universe of 22 buildings meets this criterion, and they were arranged in different regions of the municipality, as shown in Figure 1. The buildings were named A to Q, and there were two condominiums with four and three towers, named A1, A2, A3, A4, L1, L2, and L3. Notably, because all buildings in the municipality that met these requirements were selected, no technique or recommendation was used for choosing the sample universe. The selected buildings have main structure in reinforced concrete, masonry closures, and some variations in form, dimension and architectural elements of the facade, with the EMR as the predominant finish of the facade.
2.1 Local climate classification
As a typical climate classification, the global Köppen-Geiger system of climatic types has been used, widely used in the areasarea of geography, climatology, and ecology (Alvares et al., 2013). This classification is based on specific parameters for each global region of the world, so therefore, that the determination of climatic types is carried out considering based on the seasonality as well as average monthly or annual values of air temperature and precipitation.
2.2 Inspection / Data Collection
A practical and objective method was adopted for the analysis of damaged facade systems, specifically EMR; therefore, other architectural finishing elements were neglected. Inspection and registration of visible BDs were carried out with the naked eye and using a binocular. Based on the inspection sequence described by Antunes (2010), the inspection was carried out from left to right, from top to bottom, floor by floor, considering all the levels were covered and that all the problems established in the EMR were noted. Field information was duly noted in an inspection form developed specifically for this study.
2.3 Incidence Method (M-INC) and Intensity Method (M-INT)
These methods were used by Segat (2005), and they are based on two different methods of quantifying the observed pathological cases. In M-INC, each BD is quantified only once per facade, even if it occurs repeatedly, whereas all DBs are quantified in the intensity method (M-INT), regardless of the number of repetitions.
The importance of this form of survey and quantification is because M-INC allows us to highlight, which are the most common and frequent BDs for the sample space, whereas M-INT allowsobtaining more information concise about the BDs that are present in greater quantity.
 |
||||
| Figure 1. Multi-storey residential buildings studied (panoramic view) | ||||
2.4 Quantification of BDs
The total quantification of each BD was carried out preliminarily in a unitary manner for each type, facade, and location. For M-INT, in the presence of extended stains and/or cracks, until there was no physical separation from it, even if it extended over more than one floor or even the entire facade, it was quantified only once. For physical separation (discontinuity), the number of individual BDs was added. To convert the quantification to M-INC and the consequent separation of the results for each method, the following logical rule was used: if the total quantity of a certain BD that occurs in a given facade is equal to or greater than 1, it was admitted with a quantity equal to 1, and if the total quantity is equal to 0, it is assumed that quantity is equal to 0. Therefore, either 0 BD or 1 BD was quantified for each facade and BD.
2.5 Typified facade regions
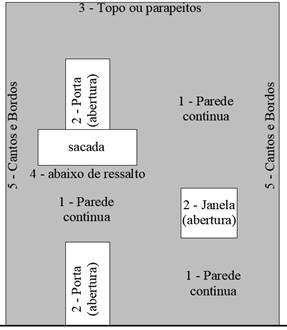
BDs were also quantified in each region of the facade, that is, according to their location. To assign the location of the BDs, the facade was divided into five areas: (1) in continuous walls-OCW, (2) around openings-OOP, (3) on top of parapets and eaves-TOP, (4) below balconies or ledges-BCP; and (5) in the corners and edges-OCE, as shown in Figure 2.
 |
||||
| Figure 2. Typified regions of the facade Source: Gaspar and Brito (2005) - modified by the Author | ||||
2.6 Delimitation
The BDs observed refer to the mostest frequent in the inspected buildings. Thus, less frequent and/or more remote pathological manifestations were excluded. This work was not aims to evaluate the mortar, its materials and the properties, the composition, the executive method also the thickness of the render.
The approach to the BDs found refers exclusively to the EMR, ignoring defects found in paint and/or other external coating than mortar. Although the inspected buildings are all constituted with a main structure in reinforced concrete and that damage to this structure can manifest BDs in the external mortar render, these structures and their possible BDs were not studied.
3. BDs mapping
The mapping of the BDs was carried out using “degradation pattern maps”, as reported by Gaspar and Brito (2005). In addition to the regions of the facade, the types of BD with the focus of this research were horizontal crack (HC), vertical crack (VC), leaning crack (LC), mapped crack (BD), detachment with blistering (BD), detachment in plates (PD), detachment with powder (WD), vesicles (VS), light stains (LS), dark stains (DS), and fantomes (FA). When other types of BD were found in the EMR, they were assigned as the designation (OT). Thus, to differentiate the location of similar BDs, they were designated with the numeral of the tified region in front of their type, such as BDHC1 (BD type horizontal crack in region 1 - on continuous wall).
The realization of the mapping consists of assessing not only the occurrence of a certain pathological problem in each specific region of the facade, but also the significance of these problems, thus attributing a corresponding level of degradation to each BD.
In this study, four adaptations were made to the method developed by Gaspar and Brito (2005). The first adaptation involves the framing of the local problems observed in the EMR of the studied buildings and the corresponding level of degradation. Second, owing to the configuration of the buildings studied (few walls at ground level and many parking areas with stilts), pathological problems at ground level were not observed, thus motivating an adjustment in the typified regions of the facades. The third adaptation involves the evaluation of results by geographic orientation of the facade and global, and in the work carried out by Gaspar and Brito (2005), only the global parameters are presented. The fourth adaptation consists of the number of maps produced, that is, “probability map,” “sensitivity map,” and “potential degradation map”.
3.1 Degradation Level
As highlighted by Gaspar and Brito (2005), the level of DB degradation is defined via a qualitative analysis, in which the BDs are classified into five levels: Level 0 (no degradation) to Level 4 (very accentuated degradation), as summarized in Table 1.
3.2 Probability Map
Using the observed data, a connection between a typified region of the facade and the probability of occurrence of some BD could be etablished. From this connection, a probabilistic relationship is established, which can be the object of the elaboration of a “probability map” that is obtained through the mathematical calculation according to Equation (1). The resulting parameter 0 indicates that there is no probability of BD occurring, whereas parameter 1 indicates that the pathological case will occur in the region.
 |
(1) |
where S(G) denotes the sensitivity of the facade for the manifestation of a certain group G of BD (varies between 0 and 1), where 0 represents no sensitivity to the formation of BDs to the specific group and 1 represents total sensitivity to the manifestation of defects:
BDRG represents the number of BDs in group G that occur in the R region,
R represents the region of incidence (1 to 5),
BDG represents the quantity of all BDs in group G (cracks, stains, or detachments),
IC and IT correspond to the methods of quantifying BDs, that is, incidence and intensity, respectively.
| Table 1. Degradation Levels | ||||||||||||||
| Degradation Level | Visual defects observed | Strategic action | ||||||||||||
|---|---|---|---|---|---|---|---|---|---|---|---|---|---|---|
| Level 0 - No degradation (desirable situation) | • No visual degradation was observed | It does not require attention | ||||||||||||
| Level 1 - Very mild degradation sinals (suitable condition) | • Leve Light superficial staining, without the presence of efflorescences | Periodic visual assessment | ||||||||||||
| Level 2 - Mild degradation sinals (acceptable condition) | • Linear cracks (vertical, horizontal or linear) isolated or widely spaced, with few repetitions along the facade | Surface cleaning by brushing and washing | ||||||||||||
| • Accentuated surface staining, with mild signs of efflorescence or presence of moisture | ||||||||||||||
| • Localized presence of mold or mildew | ||||||||||||||
| Level 3 - Wide degradation (minimum acceptable condition) | • Intense linear cracks (vertical, horizontal or inclined), occurring in several parts, but spaced apart | Repair and protection | ||||||||||||
| • Isolated mapped cracks | ||||||||||||||
| • Damaged corners or edges | ||||||||||||||
| • Localized infiltrations | ||||||||||||||
| • Light stains (efflorescences) | ||||||||||||||
| • Fantomes | ||||||||||||||
| • Alteration of tonality and surface texture | ||||||||||||||
| Level 4 - Very severe degradation (worst condition / not acceptable) | • Linear cracks very intense and not widely spaced (agglomerated) | Partial or complete replacement of the damaged element | ||||||||||||
| • Mapped cracks agglomerated or with many repetitions | ||||||||||||||
| • Detachments | ||||||||||||||
| • Vesicles | ||||||||||||||
| Source: Gaspar and Brito (2005) - modified by the Author | ||||||||||||||
3.3 Sensibility Map
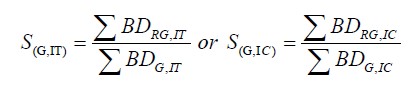
In addition to the probability of the pathological case occurring, a connection between each typified region of the facade and the possibility of the appearance of a specific pathological case could be established. From this connection, a relationship that expresses the sensitivity of the typified region to a specific BD is established, in which it is possible to elaborate a “sensitivity map” or distribution map of the BD, which is the object of the expression resulting from Equation (2). A resulting parameter of 0 indicates that the region has no sensitivity at all for the manifestation of this pathological case, whereas p indicates that the region is sensitive to the manifestation of the pathological case.
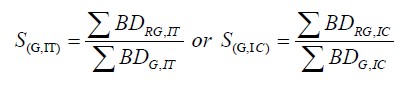 |
(2) |
where S(G) denotes the sensitivity of the facade to the manifestation of a specific group G of BD (varies between 0 and 1), where 0 represents no sensitivity to the formation of BDs to the specific group and 1 represents total sensitivity to the manifestation of defects:
BDRG represents the number of all BDs in group G that occur in the region of BD formation to the specific group, and 1 represents totally sensitive to the manifestation of defects,
R represents the region of incidence (1 to 5),
BDG represents the quantity of all BDs in group G (cracks, stains, or detachments),
IC and IT represents the methods of quantifying BDs, that is, incidence and intensity, respectively.
3.4 Potencial Degradation Map
A map of degradation potential could be drawn by weighting the BDs by their corresponding level of degradation, that is, which region is more or less degraded, according to qualitative parameters of degradation listed in Table 1 and Equation (3).
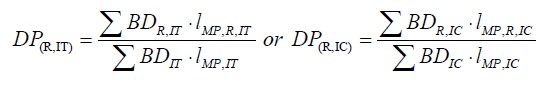 |
(3) |
where DP(R) denotes the degradation potential of a given facade region (varies between 0 and 1), where 0 represents no potential and 1 represents the maximum potential for degradation:
BDR denotes the amount of BD that occurs in región R,
lBD,R denotes the level of BD degradation that occurs in region R,
R denotes the region of incidence (1 to 5),
BD denotes the quantity of all BDs,
lBD denotes the level of general degradation considering all BDs,
IC and IT correspond to the methods of quantifying BDs, that is, incidence and intensity, respectively.
4. Results
4.1 Local climatic conditions
The local climate is classified as Aw according to the global categorization of the Köppen and Geiger climatic types, where A refers to Group A - Tropical and w represents savanna climate with dry winter. Based on the records of climatic events observed in the period from January 2015 to May 2020 provided by the INMET and CLIMATEMPO climatic portals, the climate is characterized by high daily temperatures, with maximum and minimum peaks of approximately 40 and 5 °C, respectively. The average annual temperature obtained was approximately 25 ºC, whereas the thermal amplitude obtained for the same period varied between 10 and 15 °C. Rainfall data, wind direction, and speed were also consulted for the same period. For pluviometry, higher and lower concentrations of precipitation were observed during summer (hot season) and winter (colder season), respectively, characterizing the seasonality, as highlighted by the Köppen and Geiger classification. The local atmospheric pressure suffers little daily variation, highlighting the average values from 950 to 960 hPa, with the maximum atmospheric pressure peaks following the driest season (winter), while the minimum the wettest season (summer). For the prevailing winds, these are quite present in the cardinal directions combined with the East direction and practically nonexistent in the other directions.
4.2 BDs Overview
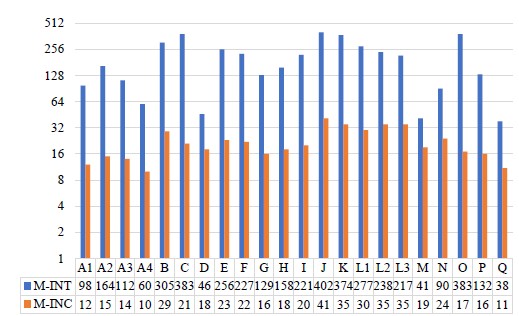
In total, 4351 BDs were detected for M-INT and 481 BDs for the M-INC, adding all types, locations, and buildings. Table 2 summarizes the total quantification for each type of BD, while Table 3 summarizes the total quantification for each group of BD and the average number of repetitions. The total of each building is shown in Figure 3. Similar to what was observed by Gaspar and Brito (2005), in which it was established that most of the buildings (93%) of the facades showed some signs of degradation, the BD of the present case study was observed in all (100%) the samples.
Using M-INC, the greatest occurrences were cracks and stains with the same amount and percentage, followed by detachments, as summarized in Table 3. Additionally, Terra (2001), Padaratz et al. (2002) obtained similar results, with more representation of the fissures, followed by the stains and finally the detachments.
Segat (2005) and Mazer et al. (2013) observed the predominance of cracks in the referred method, followed by detachments and stains. One factor to be highlighted is the location of the studies of the aforementioned works, and in the studies whose results were similar. They present a particularity in common, namely, hotter and more humid summers. However, the difference in climate did not change the predominance of cracks in this method.
Stains are much more frequent than other BDs. However, stains and cracks have the same recurrence. Carrying out a regional climatological assessment, in addition to the preferential direction of the winds, the daily cyclical temperature variation, notably observed by the large daily thermal amplitude, is a very significant factor.
| Table 2. Number of BDs by type, location and method of quantification | ||||||||||||||
| BUILDING DEFECT (BD) | M-INC QUANTIFICATION | M-INT QUANTIFICATION | ||||||||||||
|---|---|---|---|---|---|---|---|---|---|---|---|---|---|---|
| NORTH | SOUTH | EAST | WEST | TOTAL BD | NORTH | SOUTH | EAST | WEST | TOTAL BD | |||||
| BDHC1 | 11 | 8 | 13 | 13 | 45 | 52 | 74 | 36 | 53 | 215 | ||||
| BDHC2 | 2 | 0 | 5 | 2 | 9 | 2 | 0 | 8 | 4 | 14 | ||||
| BDHC3 | 6 | 4 | 2 | 3 | 15 | 26 | 18 | 2 | 14 | 60 | ||||
| BDHC4 | 0 | 1 | 2 | 1 | 4 | 0 | 1 | 15 | 45 | 61 | ||||
| BDHC5 | 3 | 0 | 0 | 0 | 3 | 4 | 0 | 0 | 0 | 4 | ||||
| BDVC1 | 5 | 6 | 5 | 1 | 17 | 30 | 19 | 14 | 2 | 65 | ||||
| BDVC2 | 3 | 1 | 5 | 1 | 10 | 5 | 2 | 43 | 14 | 64 | ||||
| BDVC3 | 1 | 1 | 1 | 1 | 4 | 1 | 7 | 1 | 3 | 12 | ||||
| BDVC4 | 0 | 0 | 0 | 0 | 0 | 0 | 0 | 0 | 0 | 0 | ||||
| BDVC5 | 5 | 3 | 2 | 2 | 12 | 15 | 6 | 4 | 7 | 32 | ||||
| BDLC1 | 4 | 7 | 8 | 5 | 24 | 21 | 66 | 30 | 18 | 135 | ||||
| BDLC2 | 1 | 1 | 5 | 3 | 10 | 4 | 2 | 80 | 35 | 121 | ||||
| BDLC3 | 3 | 2 | 1 | 1 | 7 | 4 | 3 | 2 | 1 | 10 | ||||
| BDLC4 | 2 | 1 | 0 | 0 | 3 | 13 | 100 | 0 | 0 | 113 | ||||
| BDLC5 | 0 | 0 | 0 | 2 | 2 | 0 | 0 | 0 | 3 | 3 | ||||
| BDMC1 | 6 | 6 | 9 | 7 | 28 | 72 | 8 | 30 | 57 | 167 | ||||
| BDMC2 | 1 | 1 | 1 | 0 | 3 | 1 | 4 | 1 | 0 | 6 | ||||
| BDMC3 | 1 | 1 | 1 | 1 | 4 | 1 | 1 | 2 | 4 | 8 | ||||
| BDMC4 | 0 | 0 | 0 | 0 | 0 | 0 | 0 | 0 | 0 | 0 | ||||
| BDMC5 | 2 | 1 | 1 | 2 | 6 | 12 | 2 | 2 | 10 | 26 | ||||
| BDLS1 | 2 | 5 | 2 | 2 | 11 | 6 | 32 | 7 | 20 | 65 | ||||
| BDLS2 | 0 | 0 | 0 | 1 | 1 | 0 | 0 | 0 | 1 | 1 | ||||
| BDLS3 | 0 | 0 | 1 | 1 | 2 | 0 | 0 | 1 | 9 | 10 | ||||
| BDLS4 | 0 | 0 | 0 | 0 | 0 | 0 | 0 | 0 | 0 | 0 | ||||
| BDLS5 | 1 | 1 | 0 | 0 | 2 | 8 | 1 | 0 | 0 | 9 | ||||
| BDDS1 | 7 | 7 | 8 | 10 | 32 | 45 | 67 | 134 | 37 | 283 | ||||
| BDDS2 | 7 | 10 | 12 | 9 | 38 | 298 | 261 | 442 | 271 | 1272 | ||||
| BDDS3 | 21 | 21 | 22 | 22 | 86 | 148 | 135 | 166 | 195 | 644 | ||||
| BDDS4 | 5 | 6 | 8 | 5 | 24 | 108 | 61 | 327 | 269 | 765 | ||||
| BDDS5 | 4 | 1 | 2 | 2 | 9 | 16 | 4 | 2 | 4 | 26 | ||||
| BDFA1 | 0 | 0 | 1 | 0 | 1 | 0 | 0 | 3 | 0 | 3 | ||||
| BDFA2 | 0 | 0 | 0 | 0 | 0 | 0 | 0 | 0 | 0 | 0 | ||||
| BDFA3 | 0 | 0 | 0 | 0 | 0 | 0 | 0 | 0 | 0 | 0 | ||||
| BDFA4 | 0 | 0 | 0 | 0 | 0 | 0 | 0 | 0 | 0 | 0 | ||||
| BDFA5 | 0 | 0 | 0 | 0 | 0 | 0 | 0 | 0 | 0 | 0 | ||||
| BDBD1 | 0 | 0 | 2 | 1 | 3 | 0 | 0 | 2 | 1 | 3 | ||||
| BDBD2 | 0 | 0 | 0 | 0 | 0 | 0 | 0 | 0 | 0 | 0 | ||||
| BDBD3 | 0 | 1 | 0 | 0 | 1 | 0 | 8 | 0 | 0 | 8 | ||||
| BDBD4 | 0 | 0 | 0 | 0 | 0 | 0 | 0 | 0 | 0 | 0 | ||||
| BDBD5 | 0 | 0 | 0 | 0 | 0 | 0 | 0 | 0 | 0 | 0 | ||||
| BDPD1 | 0 | 1 | 3 | 1 | 5 | 0 | 2 | 4 | 1 | 7 | ||||
| BDPD2 | 1 | 0 | 1 | 0 | 2 | 3 | 0 | 1 | 0 | 4 | ||||
| BDPD3 | 0 | 1 | 0 | 1 | 2 | 0 | 1 | 0 | 1 | 2 | ||||
| BDPD4 | 0 | 0 | 0 | 0 | 0 | 0 | 0 | 0 | 0 | 0 | ||||
| BDPD5 | 0 | 0 | 0 | 0 | 0 | 0 | 0 | 0 | 0 | 0 | ||||
| BDWD1 | 6 | 3 | 6 | 4 | 19 | 14 | 3 | 20 | 26 | 63 | ||||
| BDWD2 | 0 | 3 | 0 | 1 | 4 | 0 | 15 | 0 | 1 | 16 | ||||
| BDWD3 | 3 | 5 | 4 | 3 | 15 | 4 | 11 | 9 | 9 | 33 | ||||
| BDWD4 | 0 | 0 | 0 | 0 | 0 | 0 | 0 | 0 | 0 | 0 | ||||
| BDWD5 | 0 | 1 | 0 | 1 | 2 | 0 | 1 | 0 | 3 | 4 | ||||
| BDVS1 | 1 | 1 | 4 | 1 | 7 | 1 | 1 | 4 | 1 | 7 | ||||
| BDVS2 | 0 | 1 | 0 | 1 | 2 | 0 | 1 | 0 | 1 | 2 | ||||
| BDVS3 | 3 | 0 | 2 | 0 | 5 | 3 | 0 | 3 | 0 | 6 | ||||
| BDVS4 | 0 | 0 | 0 | 0 | 0 | 0 | 0 | 0 | 0 | 0 | ||||
| BDVS5 | 1 | 0 | 0 | 0 | 1 | 1 | 0 | 0 | 0 | 1 | ||||
| BDOT2 | 1 | 0 | 0 | 0 | 1 | 1 | 0 | 0 | 0 | 1 | ||||
| Total | 119 | 112 | 139 | 111 | 481 | 919 | 917 | 1395 | 1120 | 4351 | ||||
| Table 3. Number of BDs by group and method of quantification | ||||||||||||||
| BD GROUP | M-INT | M-INC | AVERAGE NUMBER OF REPETITIONS (M-INT/M-INC) | |||||||||||
|---|---|---|---|---|---|---|---|---|---|---|---|---|---|---|
| ABSOLUTE | RELATIVE | ABSOLUTE | RELATIVE | |||||||||||
| Cracks | 1116 | 25,65% | 206 | 42,83% | 5,42 | |||||||||
| Detachments | 156 | 3,59% | 68 | 14,14% | 2,29 | |||||||||
| Stains | 3078 | 70,74% | 206 | 42,83% | 14,94 | |||||||||
| Other types | 1 | 0,02% | 1 | 0,21% | 1,00 | |||||||||
| Total | 4351 | 100,00% | 481 | 100,00% | - | |||||||||
| Table 4. Number of BDs by solar orientation and quantification method | ||||||||||||||
| FACADE | M-INC | M-INT | ||||||||||||
|---|---|---|---|---|---|---|---|---|---|---|---|---|---|---|
| N-NORTH | 119 | 24,74% | 919 | 21,12% | ||||||||||
| S-SOUTH | 112 | 23,28% | 917 | 21,08% | ||||||||||
| E-EAST | 139 | 28,90% | 1395 | 32,06% | ||||||||||
| W-WEST | 111 | 23,08% | 1120 | 25,74% | ||||||||||
| TOTAL | 481 | 100,00% | 4351 | 100,00% | ||||||||||
 |
||||
| Figure 3. Number of BDs per building and quantification method | ||||
Considering solar orientation, in relation to M-INC, the east and north facades were the ones with the most problems, followed by the south and west facades with practically the same quantity and percentage. In the work carried out by Mazer et al. (2013), problems predominated in the north and west facades, followed by the east and south facades. For M-INT, the east and west facades were the most significant, followed by the north and south facades with practically similar quantity and percentage. The number of BDs by solar orientation and the method are listed in Table 4. In the work carried out by Antunes (2010), the distribution of problems occurred in decreasing order on the north, south, west, and east facades, whereas Consoli (2006) observed a greater occurrence on the south facade, followed by the east, west, and north facades.
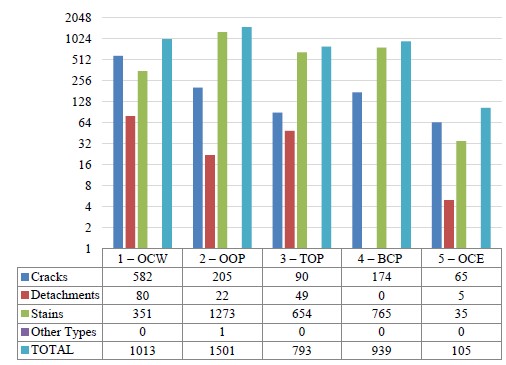
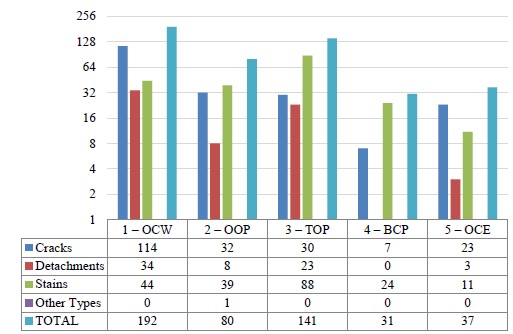
Considering the location of BDs by M-INT, there was a predominance of stains in the vicinity of openings, tops, balconies, or ledges, whereas cracks predominate in continuous walls and in the corners. The results obtained are close to the parameters reported by Gaspar and Brito (2005) and Freitas (2012), although the study region is in different climates according to the Köppen and Geiger classification, that is, Fernandópolis-SP (Aw), Lisbon, Alcochete, and Tavira (Csa) and Goiania (Aw). The same parameters and representativeness of problems were also verified using M-INC, with the exception of continuous wall stains, which overcame detachments. The results of localization by group of BD and localization are presented in Figures 4 and 5.
 |
||||
| Figure 4. Location of BDs by group and location - Intensity Method | ||||
 |
||||
| Figure 5. Location of BDs by group and location - Incidence Method | ||||
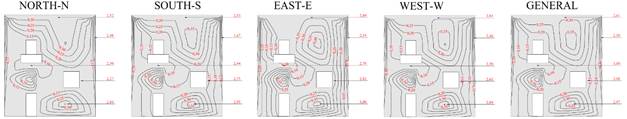
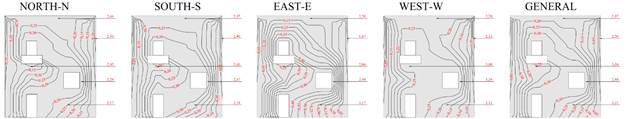
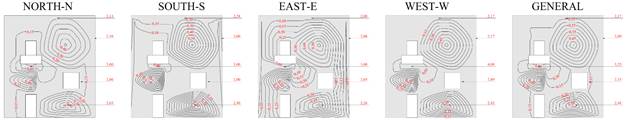
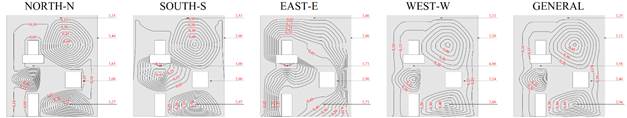
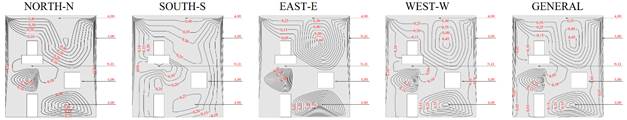
4.3 Probability of occurrence of BD and its Degradation Potential
The probability of defects occurring in each typified region of the building for each specific and general solar orientation as well as intensity and incidence methods is shown in Figures 6 and 7. The values on the right indicate the average level of degradation for each typified region of the facade. In general, for both quantification methods, the highest probability of occurrence of BD occurs in regions 1-in continuous walls, region 2-around openings, and region 3-at the top (parapets and eaves), as observed by Gaspar and Brito (2005), Antunes (2010), Freitas (2012), and Souza et al. (2019). Nevertheless, the levels of degradation were more significant in these regions. Except for the parameters obtained by Gaspar and Brito (2005), the degradation levels of regions 2 and 4 were shown to be more significant in this study.
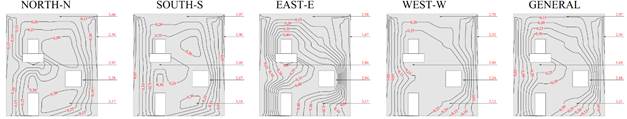
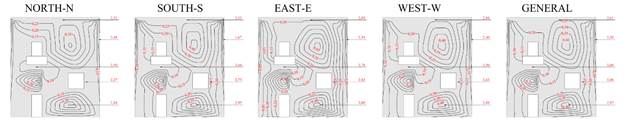
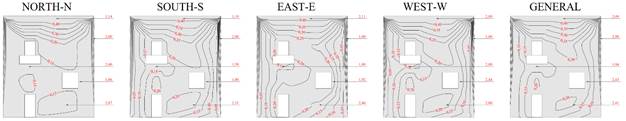
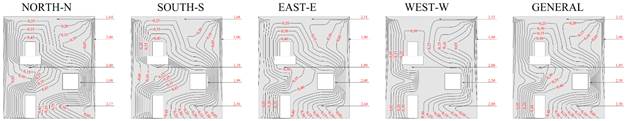
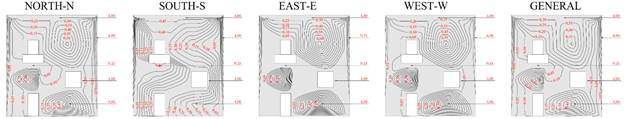
In general, there are significant differences between the results of each method applied in the quantification for the determination of the degradation potential (PD). Therefore, the recurrence of effects for each specific method occurs in a different way, that is, one for the total number of repetitions and another for the number of times it occurs, without considering the repetitions for the same facade. In this way, potentialization of effects can be identified for each method and BD. As highlighted in Table 3, although there is the same recurrence for stains and cracks, there is a much higher number of repetitions of stains against cracks, hence the importance of considering them independently and, nevertheless, interpreting their results.
Considering all solar orientations, there is a greater potential for degradation in region 1-in continuous walls than in region 3-at the top (parapets and eaves) for M-INC. For M-INT, there is a greater potential for degradation in region 2 (around openings), followed by region 1 (continuous walls). Gaspar and Brito (2005) also observed a crucial degradation in region 1 in continuous walls. The degradation potential (PD) in each typified region of the building for each specific and general solar orientation as well as intensity and incidence methods is shown in Figures 8 and 9.
 |
||||
| Figure 6. Map of Probability of occurrence of BDs - Incidence Method OBS: values on the right represent the average level of degradation of each typified region | ||||
 |
||||
| Figure 7. Map of Probability of occurrence of BDs - Intensity Method OBS: values on the right represent the average level of degradation of each typified region | ||||
 |
||||
| Figure 8. Potential Map of Degradation of the Region - Incidence Method OBS: values on the right represent the average level of degradation of each typified region | ||||
 |
||||
| Figure 9. Potential Map of Degradation of the Region - Intensity Method OBS: values on the right represent the average level of degradation of each typified region | ||||
4.4 Sensitivity to the manifestation of BDs
Sensitivity to the formation of BD refers to the sensitivity of each typified region to the formation of a specific type of BD, in which it is presented by the “Sensitivity Map”
4.4.1 Facade sensitivity to crack formation
In decreasing order, there is a greater predisposition to the formation of cracks in regions 1, 2, and 5. Cementitious matrices are easily affected by hygrothermal movements due to important variations in temperature and humidity. In the presence of large masses or strain restrictions, cracking is inevitable if the mortar used does not have specific properties for this purpose.
In the present case study, a large daily temperature range (about 15ºC), cyclic variations in humidity as well as atmospheric pressure with small daily and seasonal variations (practically constant for a short period) was observed. These particularities certainly contribute to the hygrothermal movement of the EMR, especially in the continuous walls (region 1), which are restricted to free deformation by the mortar itself, as well as representing the largest exposed surface, therefore, more subject to the effects of temperature and humidity, justifying being the most affected region.
In addition, even if there was no such important daily thermal amplitude, the temperature between EMR and air are different and, in the presence of constant atmospheric pressure, there is a contribution to the condensation of water vapor inside the mortar matrix, also causing hygrothermal movements.
The cracks present in these regions tend to obtain levels of degradation above 2.00 and highlighting average levels above 3.00, which is the minimum acceptable. Such observations were also reported by Gaspar and Brito (2005), Antunes (2010), Freitas (2012), and Souza et al. (2019). Sensitivity maps of crack-formation for the two quantification methods are presented in Figures 10. and 11.
4.4.2 Facade sensitivity to stain formation
In decreasing order, there is a greater predisposition to the formation of dark stains in regions 3, 1, and 2. Light stains are rare and recurrent; therefore, there is a large predominance of dark stains. There are too many stains on facades with solar orientation facing the prevailing wind dimensions (combined with the cardinal east direction). This could indicate that the atmospheric air in the region may have a high number of solid particles in suspension and hence the “easy sensitivity” to this predisposition. The aforementioned regions have differences and similarities regarding the mechanisms of action in the formation of BDs, and they have the same type of sensitivity. Gaspar and Brito (2005) attributed the sensitivity to the action of directed rain, specifically in those that are minimally protected by covers and overhangs. None of the study buildings have outstanding coverings for the facade panels, and this situation could also cause the problem. Figures 12 and 13 show the sensitivity maps for the formation of stains for each quantification method.
4.4.3 Facade sensitivity to detachments
The predisposition for the formation of detachments is more prevalent in regions 1, 3, and 2. This condition was also verified by Antunes (2010) and Souza et al. (2019). The detachments present in all the most sensitive regions were those with powder. This BD occurs for various reasons, but its application at high temperatures should be considered. According to a survey of the local climate, temperatures in the region are normally high at all times of the year, in addition to a high daily thermal amplitude, on the order of 15 °C. Therefore, when applying or improving the mortar property to resolve these effects, this condition must be observed.
Parallel to detachment, cracks are more recurrent and frequent also in Region 1 which, when present, contribute to the accumulation of aggressive agents in this location, favoring the potentialization of problems translated into detachment formation (highest degradation).
In addition to powdery detachment, there is a predominance of vesicles and plate detachments, manifestations commonly associated with late expansive reactions, either owing to a deficiency in the composition of the mortar trace or in the presence of impurities. Notably, these BDs in the vicinity of regions 2 and 3 occur in supposedly more humid locations and with a predominance of superficial staining.
Sensitivity maps for the formation of displacements for each typified region of the facade and the quantification method are shown in Figures 14 and 15.
5. Conclusions
Based on the results obtained, the following conclusions were observed, highlighting the climate and BD parameters:
6. Acknowledgements
We acknowledge the Dias & Cardozo company for partial financing this research, a very important private initiative in fostering research.
References
Alvares, C. A., Stape, J. L., Sentelhas, P. C., de Moraes Gonçalves, J. L., Sparovek, G. (2013), Köppen's climate classification map for Brazil. Meteorologische Zeitschrift. 22(6):711-728. https://www.doi.org/10.1127/0941-2948/2013/0507.
Ansah, M. K., Chen, X., Yang, H., Lu, L., Lam, P. T. I. (2020), An integrated life cycle assessment of different façade systems for a typical residential building in Ghana. Sustainable Cities and Society. 53:1-13. https://doi.org/10.1016/j.scs.2019.101974.
Antunes, G. R. (2010), “Estudo de manifestações patológicas em revestimentos de fachada de Brasília - Sistematização da incidência de casos”, Dissertação (Mestrado em Engenharia Civil), Faculdade de Tecnologia, Universidade de Brasília.
Bauer, L. A. F. (2017), “Materiais de Construção”. Volume 2. 5ª ed. Revisada. LTC Editora. Rio de Janeiro. 538p.
Bauer, E., Milhomem, P. M., Aidar, L. A. G. (2018), Evaluating the damage degree of cracking in facades using infrared thermography. Journal of Civil Structural Health Monitoring. 8:517-528. https://doi.org/10.1007/s13349-018-0289-0.
Carvalho, C. G., Flores-Colen, I. e Faria, P. (2015), Rehabilitation of renders of old buildings in Portugal: Survey, supporting methodology proposal and case study. Structural Survey. 33(4/5):337-353. https://doi.org/10.1108/SS-04-2015-0024.
Charisi, S., Thiis, T. K., Stefansson, P., Burud, I. (2018), Prediction model of microclimatic surface conditions on building façades. Building and Environment. 128:46-54. https://doi.org/10.1016/j.buildenv.2017.11.017.
Consoli, O. J. (2006), “Análise da durabilidade dos componentes das fachadas de edifícios sob a ótica do projeto arquitetônico”, Dissertação (Mestrado em Engenharia Civil), Programa de Pós-Graduação em Engenharia Civil, Universidade Federal de Santa Catarina.
Dorfman, G., Petrucci, H. M. C. (1989), “Recomendações para fachadas com vistas a sua maior durabilidade e facilidade de manutenção ”, Simpósio Sobre Patologia das Edificações, CPGEC/UFRGS, Porto Alegre: RS(BR), pp. 251-261.
Fabbri, K., Gaspari, J., Bartoletti, S., Antonini, E. (2020), Effect of facade reflectance on outdoor microclimate: An Italian case study. Sustainable Cities and Society. 54:1-12. https://doi.org/10.1016/j.scs.2019.101984.
Ferreira, C., Canhoto, L., Silva, A., Brito, J. (2019), Stochastic Petri-net models to predict the degradation of ceramic claddings. Building Research & Information. 47(6):697-715. https://doi.org/10.1080/09613218.2018.1501873.
Flores-Colen, I. e Brito, J. (2010), A systematic approach for maintenance budgeting of buildings façades based on predictive and preventive strategies. Construction and Building Materials. 24(9):1718-1729. https://doi.org/10.1016/j.conbuildmat.2010.02.017.
FREITAS, J. G. (2012), “A influência das condições climáticas na durabilidade dos revestimentos de fachada: estudo de caso na cidade de Goiânia-GO ”, Dissertação (Mestrado em Engenharia Civil), Escola de Engenharia Civil, Universidade Federal de Goiás.
Gaspar, P, Brito, J. (2005), Mapping defect sensitivity in external mortar renders. Construction and Building Materials. 19(8):571-578. https://doi.org/10.1016/j.conbuildmat.2005.01.014.
Maciel, A. C. F., Carvalho, M. T. (2019), Operational energy of opaque ventilated façades in Brazil. Journal of Building Engineering. 25:1-10. https://doi.org/10.1016/j.jobe.2019.100775.
Mazer, W., Silva, L. M. R., Lucas, E., Santos, F. M. C. (2016), Evaluation of pathological manifestations in buildings in terms of geographical orientation. Revista ALCONPAT. 6(2):145-156. https://doi.org/10.21041/ra.v6i2.135.
Padaratz, I. J., Canova, J. A., de Mori, L. M., Botter, R. R. (2002), “Incidências patológicas em fachadas e áreas comuns de edificações para ensino - caso do campus da Universidade Estadual de Maringá ”, Encontro Nacional de Tecnologia do Ambiente Construído, Foz do Iguaçu: PR(BR), pp. 1453-458.
Postingher, C. M., Kremer, B. M., Rossatto, F. C., Pacheco, F., Christ, R. (2019), “Avaliação das manifestações patológicas em revestimentos argamassados externos com VANT: estudo de caso em edificação multifamiliar do município de Garibaldi-RS ”, XV Congreso Latinoamericano de Patología de Construcción y XVII Congreso de Control de Calidad en la Construcció, CONPAT. 2:1-15. https://doi.org/10.21041/CONPAT2019/V2PAT296.
Prefeitura de Fernandópolis (2012), “Fernandópolis - nossa história nossa gente ”. Vol. II. Ed. Anglo. Santo Amaro.
Rodrigues, J. D. (2014), Defining, mapping and assessing deterioration patterns in stone conservation projects. Journal of Cultural Heritage. 16(3):267-275. https://doi.org/10.1016/j.culher.2014.06.007.
Saviz, M., Luc E, C., Saeed, M. M. (2020), Design strategies using multi-criteria decision-making tools to enhance the performance of building façades. Journal of Building Engineering. 30:1-28. https://doi.org/10.1016/j.jobe.2020.101274.
Segat, G. T. (2005), Manifestações patológicas observadas em revestimentos de argamassa: estudo de caso em conjunto habitacional popular na cidade de Caxias do Sul (RS), Dissertação (Mestrado Profissionalizante em Engenharia), Universidade Federal do Rio Grande do Sul.
Sentena, J. A. A., Kazmierczak, C. de S., Krein, L. A. (2018), Degradação de revestimentos de argamassa com finos de resíduos de concreto por ciclos térmicos. Ambiente Construído. 18(1):211-224. https://doi.org/10.1590/s1678-86212018000100217.
Silva, A., Dias, J. L., Gaspar, P. L., Brito, J. (2013), Statistical models applied to service life prediction of rendered façades. Automation in Construction. 30:151-160.https://doi.org/10.1016/j.autcon.2012.11.028.
Silva, A., Brito, J. de, Gaspar, P. L. (2011), Service life prediction model applied to natural stone wall claddings (directly adhered to the substrate). Construction and Building Materials. 25(9): 3674-3684. https://doi.org/10.1016/j.conbuildmat.2011.03.064.
Silva, A., Brito, J, Gaspar, P. L. (2018), A comparative multi-criteria decision analysis of service life prediction methodologies for rendered façades. Journal of Building Engineering. 20:476-487. https://doi.org/10.1016/j.jobe.2018.08.009.
Souza, J., Silva, A., Brito, J., Bauer, E. Service life prediction of ceramic tiling systems in Brasília-Brazil using the factor method. Construction and Building Materials. 192:38-49. https://doi.org/10.1016/j.conbuildmat.2018.10.084.
Souza, J. S., Piazzarollo, C. B., Bauer, E. (2019), “Degradação nas diferentes zonas de fachadas em sistemas de revestimento”, Simpósio Brasileiro de Tecnologia das Argamassas, XIII STBA, Goiania: GO(BR), pp. 136-144.
Takeda, O. T., Mazer, W. (2018), Potential of thermographic analysis to evaluate pathological manifestations in façade cladding systems. Revista ALCONPAT. 8(1):38-50. https://doi.org/10.21041/ra.v8i1.181.
Terra, R. C. (2001), “Levantamento de manifestações patológicas em revestimentos de fachada de edificações da cidade de Pelotas ”, Dissertação (Mestrado em Engenharia), Universidade Federal do Rio Grande do Sul.
Thomaz, E. (2020), “Trincas em edifícios: causas, prevenção e recuperação”. 2. ed. 1ª reimp. São Paulo, Ed. Oficina de Textos.
Vieira, S. M., Silva, A., Sousa, J. M. C., Brito, J., Gaspar, P. L. (2015), Modelling the service life of rendered facades using fuzzy systems. Automation in Construction. 51:1-7. https://doi.org/10.1016/j.autcon.2014.12.011.