
| Review | https://doi.org/10.21041/ra.v10i2.478 |
Rebar corrosion modelling and deterioration limit state
Modelando a corrosão da armadura e estado limite de deterioração
Modelado de la corrosión de la armadura y estado límite de deterioro
1 International Centre for Numerical Methods in Engineering (CIMNE), Spain..
*Contact author: candrade@cimne.upc.edu
Reception: December 08, 2019.
Acceptance: April 09, 2020.
Publication: April 30, 2020.
| Cite as: Andrade, C. (2020), "Rebar corrosion modelling and deterioration limit state", Revista ALCONPAT, 10(2), pp. 165 – 179, DOI: https://doi.org/10.21041/ra.v10i2.478. |
Abstract
In present work the limitations of the models of corrosion initiation with indications to overcome them, are presented. Performance based design of durability is at present a trend considered in fib Model Code (MC2010). However, we are still far from accurately predicting the performance of a structure in a specific environment, in spite of which performance-based requirements are introduced in the concrete specifications of large infrastructures demanding 100 years or more of service life. Also are commented the depassivation step and the propagation period with considerations on their probabilistic treatment. It is proposed to consider corrosion onset as a “deterioration or initiation Limit State” (DLS or ILS). An example of calculation the time to cover-cracking induced corrosion is included.
Keywords:
concrete,
chlorides,
carbonation,
corrosion,
reliability.
Resumo
No presente trabalho são apresentadas as limitações dos modelos de iniciação da corrosão com indicações para superá-los. O projeto de durabilidade baseado no desempenho é atualmente uma tendência considerada no Model Code fib (MC2010). No entanto, ainda estamos longe de prever com precisão o desempenho de uma estrutura em um ambiente específico, apesar dos requisitos baseados em desempenho serem introduzidos nas especificações concretas de grandes infraestruturas que exigem 100 anos ou mais de vida útil. Também são comentados o processo de despassivação e o período de propagação com considerações sobre seu tratamento probabilístico. Propõe-se considerar o início da corrosão como um "estado limite de deterioração ou iniciação" (DLS ou ILS). Um exemplo de cálculo é o tempo de corrosão induzida por fissuras no cobrimento.
Palavras-chave:
concreto,
cloretos,
carbonatação,
corrosão,
confiabilidade.
Resumen
En el presente trabajo se analizan las limitaciones de los modelos de iniciación de la corrosión con indicaciones prácticas para superarlas. Es una tendencia mundial el desarrollo de normativa basada en prestaciones como se plasmó en el Código Modelo MC2010 del FIB. Sin embargo, los modelos de predicción todavía adolecen de mucha incertidumbre cuando se aplican a una estructura específica, a pesar de lo cual es creciente el número de especificaciones en grandes infraestructuras que exigen 100 años o más de vida útil. También se comentan la etapa de despasivación y el período de propagación con consideraciones sobre su tratamiento probabilísta. Se propone considerar el inicio de la corrosión como un "estado límite de deterioro o iniciación" (DLS o ILS) con un ejemplo de cálculo.
Palabras clave:
hormigón,
cloruros,
carbonatación,
corrosión,
fiabilidad.
1. Introduction
Prediction of service life related to reinforcement corrosion is at present a developing matter because mathematical models have been published (Tuutti, 1982; Bakker, 1994; CONTECVET Manual, 2001; DURACRETE, 1998; MC 2010, 2012) and it is increasing the demand of predefined service life beyond 100 years in the critical infrastructures. The models are usually based in assuming that the carbonation front or the chloride threshold penetrates by diffusion therefore, Fick’s second law in non-steady-state conditions, is applied. However, it has to be emphasized that there is not a model that could have been applied to concrete structures older than 30 years and that the cements and the concretes fabricated around one century ago, are different than present ones. This lack of long term verification is important to be remembered by the designers and prescriptors, because frequently it is found in the international contracts requests of 120 or 150 years of service life, which have to be considered more as a guess than a fact. There is not a manner, at present, to distinguish by testing a concrete lasting 100 years without corrosion of another having 120 years of service life. In spite of this limitation it is certainly important to study further the tests and the models related to durability in order, precisely, of improving present understanding and fill the gaps in knowledge.
The uncertainty in the prediction has led to the application of risk analysis and probabilistic concepts and thus, in Model Code 2010 (MC 2010, 2012) it is defined the several limit state functions (LSF) related to carbonation, chloride ingress, frost attack, and leaching. The consideration of the uncertainties aims into the need to identify which kind of limit state should be applied to processes related to concrete durability and which probability of corrosion or deterioration would be adequate.
In present work some of the aspects related to the limitations of the rebar corrosion models and its probabilistic aspects will be commented attending to the typical sequence of: initiation period, depassivation limit and corrosion propagation, to end with some considerations on the limite state associated to corrosion.
1.1 Initiation period
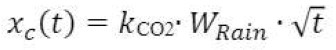
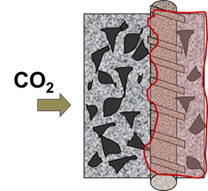
Carbonation and chloride ingress are identified as the two main causes of rebar corrosion (Bazant, 1979; Tuutti, 1982; CONTECVET Manual, 2001; DURACRETE, 1998; MC 2010, 2012). Carbonation is a process in which its rate is almost constant along the life, and then the typical square root law can be applied (see equation [1]) where V CO2 is the rate of carbonation under reference conditions and xc is the carbonation depth.
 |
[1] |
This V
CO2
depends on the chosen concrete mix (w/c-ratio, cement type and mineral additions) and on the influence of the execution or of the environmental conditions (mean relative humidity and CO2-concentration). In general, the carbonation progresses faster when the RH if the exterior of concrete is between 45 and 65%. The carbonation depth decreases with higher RH (Bakker, 1994) (figure 1). The introduction of this effect into equation [1] is made by the available models in several manners. They are:

[1’]
[1’’]
In figure 1 it is given results of the comparison of rates of carbonation (Galan et al. 2010) of tests of specimens in Madrid’s climate during 4 years of two kind of concretes (with w/c ratios of 0.45 and 0.6 and in accordance, 400 and 300 Kg of cement by m3 of concrete) exposed outdoor sheltered and exposed to rain. The resulting equation in these tests is given next. This relation may be different in other climates.

[1a]
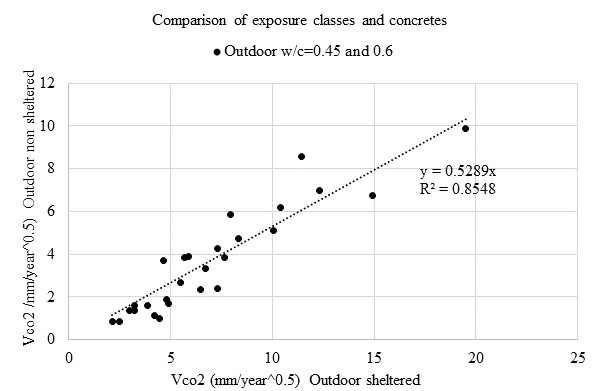
Figure 1.
Relation between the velocity of carbonation in non-sheltered from rain and protected from rain conditions in the climate of Madrid.
This equation leads to apply an exponent of 0.31 instead of 0.5 in [1’] and as indicated in the figure 1, means that the rate of carbonation exposed to rain is approximately the half of that when the same concrete is sheltered form rain (Madrid climate).
In the case of chloride penetration, the calculation is made through the expression named “equation of the error function” (equation [2]) where C(x, t) is the critical chloride concentration leading to depassivation inside the concrete at a distance x for a time t, Cs is the surface or external chloride concentration, and Dap is the Apparent Diffusion Coefficient:
 |
[2] |
With respect to the chloride ingress three main limitations have been identified in the application of equation [2] (Andrade, 2014):
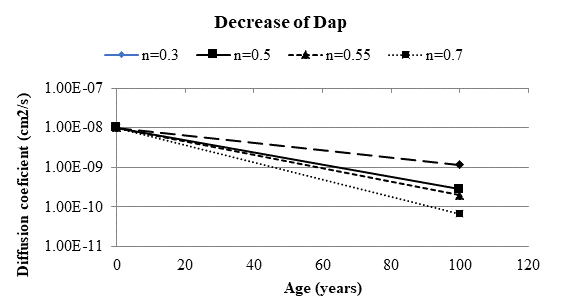
The decrease with time of the chloride diffusion coefficient is empirically addressed (Mangat and Molloy, 1994) by considering that Dap decreases with time (figure 2) following equation [3] where n=“aging factor”, D0 = the diffusion coefficient at the initial testing time t0 (usually 28 days) and ti is the period until when the coefficient is assumed to decrease:
 |
[3] |
This equation indicates that the initial value of the Dap is changed for a smaller one for the calculations in equation [2]. Although generally accepted, it is not indicated how or when to test the decrease and the period of time of its application. In consequence, if the period of application is long time, it leads into a too low diffusion coefficient as shown in figure 2, where it can be deduced that depending on the aging factor (n) considered, the decrease may be of one or two orders of magnitude. Then, due to the uncertainties on the extrapolation from a short term test to long term, the decrease has to be limited. One possible “good practice” is to limit, depending on the type of cement, the decrease to 1year (Portland cement), 5 years (cement with mineral addition other than slags or limestone) or 10 years (cements with slag as mineral addition) or to a decrease of to limit to a maximum of one order of magnitude. Finally, a modification to this equation has been proposed by Gulikers (Tang and Gulikers, 2007) (see equation [4])
|
[4] |
By calculating Dap through this expression, the same result is obtained by means of finite elements methods or by the analytical direct calculation of equation [2].
To overcome the problem of a variable surface concentration it is viable to use the surface concentration obtained in a natural diffusion test lasting 90 days. This time is long enough to allow biding to reach equilibrium with the external chloride concentration.
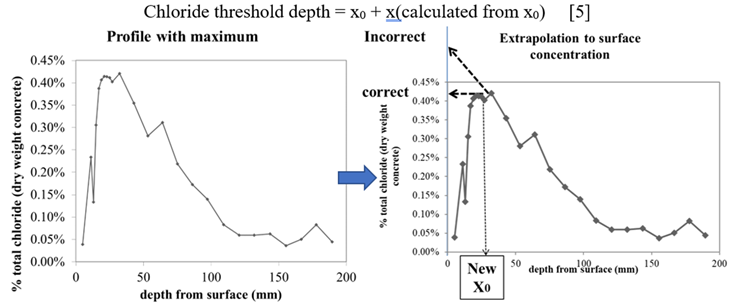
The other main limitation is related to the building up of a “pic” or maximum in the chloride concentration of a profile (figure 3-left) (Andrade, 2015). This maximum has been attributed to “convection” by capillary absorption , although it seems more likely that it is due to the carbonation of the surface, but these reasons are not sufficient to explain how it is possible that the surface concentration could be lower than the external one, because the chloride concentration is almost nil at the concrete surface in figure 3. It has to be also remarked, that, in order to calculate the Apparent diffusion coefficient, Dap,, equation [2] can be fitted into this profile shape with the maximum, providing the “zero” depth (figure 3-right) is considered that of the maximum position (Andrade, 2015) because the profile from the maximum evolves following Fick’s law. That is, the fitting of equation [2] should not be made by extrapolating the maximum back to the surface, because the surface concentration would be much higher than the real one. The value of x0 in the figure (distance from surface to the maximum position) should be added to the result of calculation of the depth of the chloride threshold (Andrade, 2015) from equation [2]. What is unknown is how the chlorides deplete at the surface and how the maximum moves inwards, that is, the law of its evolution with time to long term.
1.2 Depassivation step
It is assumed that depassivation means starting of corrosion, but it is not easy to identify the onset of corrosion in the real structures because the initial depassivated zone can be so small (figure 4) that it is not noticed. No external sign can be detected until concrete cover cracks or corrosion spots appear on the surface. No changes in the serviceability of the concrete are detected at depassivation onset. Then, unless electrochemical monitoring of the corrosion parameters is made, there is not the possibility to detect corrosion initiation. Even performing an electrochemical monitoring, the identification of depassivation in real conditions is not an easy task due to the changes in temperature and moisture. This difficulty of how to detect and measure the depassivation onset will not be addressed in present work; however some considerations on the consequences of this fact will be mentioned next.

Figure 4.
Small spots of corrosion due to chloride attack
Two main aspects will be analysed on the depassivation process: its duration and the variability of the chloride threshold. The duration because depassivation is not an instantaneous process, but it lasts a period of time due to the intrinsic heterogeneity of the concrete which make the threshold front to be irregular.
For carbonation the corrosion threshold is reached when the pH value drops below 8-9, which precisely coincide with the pnolphthalein colour-change from purple to colourless. Due to the presence of aggregates this carbonation front is not fully steep (Thiery, 2007) but additionally is irregular and then the surface of the bar will be depassivated irregularly (figure 5), what is maintained until the front advances deeper. The variability of the front can be characterized by an averaged value and a standard deviation (for instance resulting in between the 15% and the 25% of the coefficient of variation).
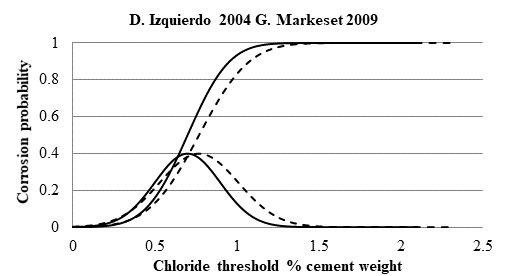
With respect to the chloride process, the corrosion starts when certain critical chloride concentration entries in contact to the steel surface. The normal value considered in numerous standards is of 0.4% by weight of cement, although values as higher as 2-3% may not developed corrosion in some circumstances. Then, the threshold is not a fixed quantity, but is a range of values (Izquierdo et al. 2004; Markeset, 2009) that can be treated statistically. The distribution from Izquierdo et al. (Izquierdo et al. 2004) is given in figure 6. It has an averaged value of Cx= 0.70 % (by concrete mass) with a standard deviation of ± 0.20%. The statistical distribution of Markeset (Markeset, 2009) found in real structures is almost similar (bridges in Norway where cores were drilled until the bar and observation of incipient corrosion was identified as the chloride threshold).
1.3 Propagation of corrosion
The progressive corrosion advance and loss in cross diameter of the bar and the oxides formed will induce several structural consequences which were described in CONTECVET Manual (2001) (figure 7):
(a) Decrease in cross section and bar ductility.
(b) Cover cracking
(c) Steel/concrete bond deterioration and
(d) Load-bearing capacity loss in regarding ULS.
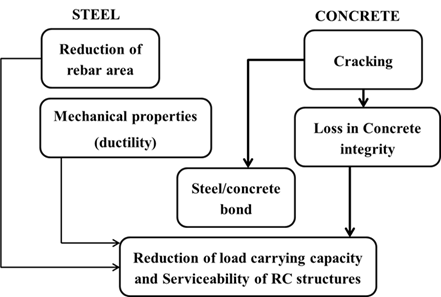
Figure 7.
Consequences of rebar corrosion (CONTECVET Manual, 2001).
In order to calculate the time to reach one of these “failure” conditions it is necessary to have a model for the evolution of the bar diameter loss. A model was proposed years ago by Andrade et al (Andrade, 1989; Andrade, 2004) based in that of Tuutti (Tuutti, 1982). The preliminary model has been updated more recently (Andrade, 2017) which is shown in figure 8 as a bilinear propagation model expressed by the equation [5]:
 |
[5] |
Where tp is the propagation period, Pcorr is the loss in bar diameter or “accumulated corrosion”, Vcorr is the corrosion rate, (0 is the initial diameter, (t is the final one after t years of corrosion. The conversion factor between Vcorr and Icorr is: Vcorr (mm/year) = 0.0116 ( Icorr ((A/cm2). Figure 8 presents the complete service life model (Tuutti, 1982; Andrade, 2017) having in mind the possibility that the corrosion rate is not only constant (line A in figure 8) but that it might be also presenting a two-step behaviour: line B would be the case when the corrosion decreases with time and line C that when it increases with time (for example when the cover cracks due to the corrosion in very wet environment). It also shows a “failure condition” of cracking (limit state of cover cracking parallel to the bars) depending on the degree of corrosion (Andrade, 2017).
The corrosion rate depends on the concrete porosity, the degree of water saturation and the temperature of each local environment. Taking the exposure classes defined in the European standard EN 206, in Table 1 are given values of the Vcorr (considering linear its progress) and time of wetness (Wt) with the expected standard deviations (CONTECVET Manual, 2001; DURACRETE, 1998). It is also given the pitting factor, (.
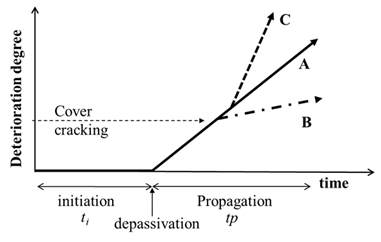
Figure 8.
Service life model with the trends of the propagation period
| Table 1. Values of Vcorr, Wv and the pitting factor ( from (2.3) | ||||||||||
| EXPOSURE CLASSES | Vcorr, a [mm/year] | Wt [-] | α pitting factor | |||||||
|---|---|---|---|---|---|---|---|---|---|---|
| Mean | St. Dev. | Distr. | Mean | St. Dev. | Distr. | Mean | St. Dev. | Distr. | ||
| No risk of corrosion | 0 | - | D | 0 | - | D | - | - | - | |
| CARBONATION (Totally carbonated) | ||||||||||
| Sheltered | 0.002 | 0.003 | W | 0.5 | 0.12 | N | 2 | 0 | D | |
| Unsheltered | 0.005 | 0.007 | W | 0.75 | 0.20 | N | 2 | 0 | D | |
| CHLORIDE INITIATED CORROSION | ||||||||||
| Wet | 0.004 | 0.006 | W | 1 | 0.25 | N | 9.28 | 4.04 | N | |
| Cyclic wet-dry | 0.030 | 0.040 | W | 0.75 | 0.20 | N | 9.28 | 4.04 | N | |
| Airborne sea water | 0.030 | 0.040 | W | 0.5 | 0.12 | N | 9.28 | 4.04 | N | |
| Submerged | Not expected or 0.010 | |||||||||
| Tidal zone | 0.070 | 0.100 | W | 1 | 0.25 | N | 9.28 | 4.04 | N | |
As the climate may be constant or repeated every year, the accumulated corrosion or corrosion depth, Pcorr, (see figure 9), which is the loss in diameter Pcorr, = ((= (0- (i, can be, as previously commented, linear with respect to the time (line A in figure 8) or can be considered a two-lineal trend where the corrosion decreases with time (Vcorr1>Vcorr2 -line B) or increases (Vcorr1<Vcorr2 - line C).

Figure 9.
Evolution of the loss in diameter Pcorr with the advance of the aggressive front.
If the corrosion is localized, there is a dependence of the maximum pit depth from the homogeneous corrosion by which it is possible to establish that (Gonzalez et al,1995, CONTECVET Manual, 2001):
 |
[6] | or | 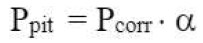 |
[6’] |
Where α is the “pitting factor” (see table 3) which accounts for the maximum pit depth. That is, the maximum pit depth is ( times deeper than if the corrosion would have been homogeneous. The average value is α =10, although it may range in the case of chloride attack from 3 to 15 times.
2. Corrosion limit states
The evolution towards a performance based durability design has added the probabilistic treatment to the calculation of the concrete durability, as developed in Duracrete project (DURACRETE, 1998) and incorporated into the fib Model Code 2010 (MC 2010, 2012) to the above conventional treatment. For the probabilistic treatment, a Limit State Function is defined whose general formulation is next given as equation [7]. A probability of failure is associated to the depassivation step. Thus:
 |
[7] |
where:
This general expression is particularized for each deterioration process. In the case of reinforcement corrosion, the traditional limit state considered is the time to steel depassivation. However, as mentioned this limit state does not fulfil the classical definition of SLS of the standards ISO 16204 (ISO, 2012) and ISO 2394 (ISO, 2015) for the SLS: a state which corresponds to conditions beyond which specified serviceability requirements for a structure or its components are no longer satisfied, because when corrosion just starts, any detrimental effect is produced at the structural level and any sign of damage or any effect is detected. All serviceability requirements continue being fulfilled during the first stages of the corrosion process. It seems much more appropriate the definition of an “Initiation” or “Deterioration Limit State” ILS or DLS, given in ISO standard 13283 (ISO, 2008) as: a state which corresponds to the initiation of significant deterioration of a component of the structure.
A consequence of this proposal is that the reliability associated to the depassivation may not be that of a typical SLS (probabilities of around 10%), but should be one considering the consequences of the corrosion initiation only, which are negligible in general. These consequences were mentioned before (figure 7) and having taken a corrosion propagation model and suggested values of Vcorr, it is possible to analyze the effect of the deterioration level in the consequences of corrosion and select the most adequate reliability level. Further, the designer should as well, verify the standard SLS or the ULS. The procedure for the design (full probabilistic) briefly would include:
2.1 Example: Verification of cover cracking induced corrosion
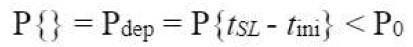
For the sake of describing an example, cover cracking induced corrosion (parallel to the bars and not transversal to them due to the flexural loads) is proposed to be considered as a SLS, because when the cover in parallel to the bars a “condition state beyond that of the design” is reached in the same manner than when the cracks are transversal to the bars. The limit state of cracking induced corrosion can be calculated as suggested in MC2010 (MC 2010, 2012) through the equation [8]:
 |
[8] |
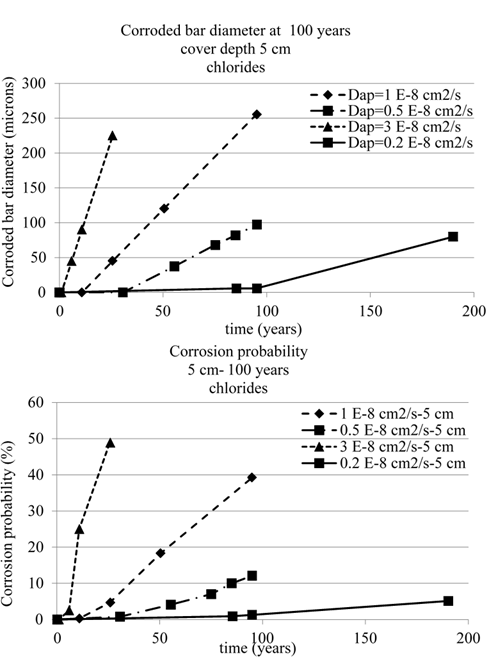
where: P{} is probability that parallel cracks are produced, tSL is the design service life [years], tini is initiation period [years], tprop is propagation period [years], P0 is target failure probability. Figure 10 shows for the sake of illustration of the example, the probability of cover cracking (for bar diameter loss of Pcorr= 100 (m (Andrade et al. 2017) associated to the cover cracking) for several chloride diffusion coefficients (and corrosion rates associated to the concrete quality) in a hypothetical element of 5 cm in cover and a service life of 100 years.
The most important deductions from these figures are that the cover cracking probability is not unique, but varies with the rate of chloride ingress and of the corrosion rate. Other input parameters, as the aging factor or the coefficient of variation also influence the probability of reaching Pcorr= 100 (m of diameter loss within the life time period. It is worth to notice that, logically, the probability of cover cracking when reaching 100 (m of diameter loss is smaller as the concrete is of higher quality, because the depassivation will be produced later. Reversely, lower quality concretes show that a higher probability is found at the end of the target service life. Then, it cannot be established a single value as a unique failure probability, but would depend on the concrete quality. The fact that the reliability is structure-dependent is general and that is why the semi-probabilistic format with general “safety factors” is the normal method in the existing Codes. In order to take a particular safety factor numerous cases and their economic consequences have to be analyzed, in order to select the optimum giving the highest safety at the minimum cost.
2.2 Verification of ULS
The methodology of calculation of the ULS is similar to the one of calculation for the DLS or SLS through the determination of the accumulated corrosion, Pcorr, from the exterior part of the reinforcement (figure 9) and the consideration of the corresponding general or localized loss of section. Then, from the reduced section of the bar, concrete and from the decreased steel/concrete bond, the loss in load bearing capacity of the concrete section can be recalculated. It is out of present work a detailed explanation. This detailed explanation can be found in Contecvet Manual (CONTECVET Manual, 2001) and the published Reports from Duracrete project (DURACRETE, 1998).
3. Conclusions
In spite of the progresses made in the calculation of service life in the last 20 years and the publication of models in the MC2010 (MC 2010, 2012), still numerous uncertainties remain and predictions at 100 years are not accurate enough. In present work, it has been tried to propose some advances with respect to present knowledge. These are:
4. Acknowledgements
The author is grateful to the funds provided by the Ministry of Economy, Industry and Competitivity of Spain. Also is grateful to the fruitful discussions in the committee TG 8.3 of Commission 8: Durability of fib, and with the members of the JCSS dealing with “Environmental loads chapter” of the Probabilistic Model Code.
References
Andrade, C. (2014). 2013 W.R. Whitney Award Lecture: Probabilistic Treatment of the Reinforcement Corrosion. Corrosion, vol. 70, No. 6. pp. 643-651, https://doi.org/10.5006/1049
Andrade, C. (2017), Reliability analysis of corrosion onset: initiation limit state, Journal of Structural Integrity and Maintenance, Pages 200-208, https://doi.org/10.1080/24705314.2017.1388693
Andrade, C., Alonso, C., Gulikers, J., Polder, R., Cigna, R., Vennesland, Ø., Salta, M., Raharinaivo, A., Elsener, B. (2004). "RILEM TC 154-EMC: Electrochemical Techniques for Measuring Metallic Corrosion. Recommendations Test methods for on-site corrosion rate measurement of steel reinforcement in concrete by means of the polarization resistance method." Materials and Structures, 37(273): 623-643.
Andrade, C., Alonso, C., Rodríguez, J. (1989), “Remaining service life of corroding structures”, Proceedings IABSE Symposium on Durability, Lisbonne, pp. 359-363
Andrade, C., Climent, M. A., de Vera, G. (2015), Procedure for calculating the chloride diffusion coefficientand surface concentration from a profile having a maximumbeyond the concrete Surface, Materials and Structures 48:863-869, https://doi.org/10.1617/s11527-015-0543-4
Andrade, C., Díez, J. M., Cruz Alonso, A. (1997) “Mathematical modelling of a concrete surface “skin effect" on Diffusion in chloride contaminated media”. Advances Cement Based Materials, vol.6 (2), 39-44. https://doi.org/10.1016/S1065-7355(97)00002-3
Bakker, R. (1994), “Prediction of service life reinforcement in concrete under different climatic conditions at given cover”, Corrosion and Protection of Steel in Concrete International Conference, Sheffield (U.K.), R.N. Swamy Ed.
Bazant, Z. P. (1979), Physical Model for steel corrosion in concrete sea structures. Theory and application. ASCE Journal of structural Division, June- ST6-p. 14551 (1138-1153)
CONTECVET Manual (2001), A validated user’s manual for assessing the residual life of concrete structures, DG Enterprise, CEC. (The manual can be downloaded from the web site of www.ietcc.csic.es)
DURACRETE (1998), Probabilistic Performance based durability design of concrete structures, Brite EuRam Project 95 - 1347.
Galan I., Andrade C., Mora P., Sanjuan M. A. (2010), Sequestration of CO2 by Concrete Carbonation, Environ. Sci. Technol. 44, 3181-3186.
Gonzalez J.A., Andrade C, Alonso C, Feliu S. (1995), Comparison of rates of general corrosion and maximum pitting penetration on concrete embedded steel reinforcement. Cement and Concrete Research; 25(2): 257-264.
International Organization for Standardization (ISO) (2012), ISO 16204-Durability - Service life designof concrete structures.
International Organization for Standardization (ISO) (2015), ISO 2394- General principles of reliability for structures.
International Organization for Standardization (ISO) (2008), ISO 13283- General principles on the design of structures for durability.
Izquierdo, D., Alonso, C., Andrade, C., Castellote, M. (2004). Potentiostatic determination of chloride threshold values for rebar depassivation Experimental and statistical study, Electrochimica Acta, 49(17-18): 2731-2739, https://doi.org/10.1016/j.electacta.2004.01.034
Mangat, P. S., Molloy, B. T. (1994), Predicting of long term chloride concentration in concrete. Materials and Structures, 27, 338-346. https://doi.org/10.1007/BF02473426
Markeset, G. (2009), Critical chloride content and its influence on service life predictions Critical chloride content and its influence on service life predictions, Materials and Corrosion, 60, No. 8593-596, https://doi.org/10.1002/maco.200905288
MC 2010 (2012), The fib Model Code for Concrete Structures 2010. fib http://www.fib-international.org/fib-model-code-2010 .
Tang, L., Gulikers, J. (2007), On the Mathematics of Time-dependent Apparent Chloride Diffusion Coefficient in Concrete. Cement and Concrete Research, Volume 37, Issue 4, Pages 589-595, https://doi.org/10.1016/j.cemconres.2007.01.006
Thiery, M., Villain, G., Dangla, P., Platret, G. (2007), Investigation of the carbonation front shape on cementitious materials: Effects of the chemical kinetics, Cement and Concrete Research, 37(7), 1047-1058, https://doi.org/10.1016/j.cemconres.2007.04.002
Tuutti, K. (1982), “Corrosion of steel in concrete”, Swedish Cement and Concrete Institute (CBI) nº 4-82. Stockholm.