
Casos de Estudio
Concrete strength control: ABNT, ACI and EN comparative procedures. Site study case
Control de la resistencia a la compresión del concreto: análisis comparativo entre los procedimientos propuestos por la ABNT, ACI y EN. Estudio de caso
Controle da resistência à compressão do concreto: análise comparativa entre os procedimentos propostos pela ABNT, ACI e EN. Estudo de Caso
Concrete strength control: ABNT, ACI and EN comparative procedures. Site study case
Revista de la Asociación Latinoamericana de Control de Calidad, Patología y Recuperación de la Construcción, vol. 8, no. 3, 2018
Asociación Latinoamericana de Control de Calidad, Patología y Recuperación de la Construcción, A. C.
Received: 16 March 2018
Accepted: 19 July 2018
Published: 31 August 2018
Abstract: This paper presents an approach regarding the control of compressive strength of concrete performed by Brazilian standard, additionally was proceeded with an analysis, from the same data, performed by ACI 318-14 and EN 206. In Brazil, the control of the axial compressive strength of concrete proceeds by following ABNT NBR 12655:2015. However, when this control is proceeded by other standards criteria, the results are not coincident. The ACI 318 procedures of sampling and the acceptance criteria are different from the model adopted by Brazilian standard. For this paper, a real case study was carried out, where a fck=40MPa, (SCC) has been produced, during 2 years and 9 months and poured on the building structure located in the city of São Paulo.
Keywords: strength control of concrete, variability of concrete compressive strength, comparison standard ABNT NBR 12655 with ACI 318 and EN 206.
Resumen: Se presentan resultados del control de resistencia a compresión del concreto con la normalización brasileña, así como comparaciones con los controles propuestos por ACI 318-14 y EN 206. En Brasil, el control de resistencia a compresión del concreto es conforme la ABNT NBR 12655: 2015. Sin embargo, cuando este control se realiza bajo otras normas, los resultados finales no coinciden, debido a que el procedimiento de muestreo y los criterios de aceptación son distintos. Para este artículo se realizó un estudio de caso real, donde se empleó una dosificación de concreto con fck=40MPa, auto consolidable, producido durante 2 años y 9 meses y aplicado en la estructura de un emprendimiento en la ciudad de São Paulo.
Palabras clave: control de la resistencia del concreto, variabilidad de la resistencia a la compresión del hormigón, comparación normas ABNT NBR 12655: 2015 con ACI 318-14 y EN 206.
Resumo: Neste artigo estão apresentados os resultados obtidos no controle de resistência à compressão do concreto realizado conforme normalização brasileira, bem como análises comparativas com os controles propostos pelo ACI 318-14 e EN 206. No Brasil, atualmente, o controle da resistência à compressão do concreto é realizado conforme a ABNT NBR 12655:2015. Entretanto, quando este controle é realizado à luz de outras normas, os resultados obtidos não coincidem, devido ao fato dos procedimentos de amostragem e critérios de aceitação serem distintos. Este artigo apresenta um estudo de caso real, onde foi empregado um traço de concreto fck =40MPa, autoadensável, produzido durante 2 anos e 9 meses e aplicado na estrutura de um empreendimento localizado na cidade de São Paulo.
Palavras-chave: controle da resistência do concreto, variabilidade da resistência à compressão do concreto, comparação normas ABNT NBR 12655:2015 com ACI 318-14 e EN 206.
INTRODUCTION
Currently in Brazil, the control of the compressive strength of the concrete is carried out according to the requirements of ABNT NBR 12655:2015 "Portland cement concrete - Preparation, control, and acceptance - Procedure", which presents, in section 6.2 "Compressive strength tests”, maximum limits for the formation of concrete lots, sampling criteria and the two types of technological control considered: statistical control by partial sampling and control by total sampling, 100% of concrete production.
In the control by partial sampling the samples are randomly collected from different concretes, regarding the minimum number of specimens for subsequent determination of fck,est (f`c) by mathematical expressions (with statistical basis) denominated estimators . These expressions consider a number of samples between 6 ≤ n ˂ 20. For samples with twenty or more units (n ≥ 20), the determination of fck,est uses the mean resistance (fcm) and the deviation production standard, denominated as sd, by fck,est = fcm – 1,65*sd .
In partial sample control, the value of fck,est is obtained and must be compared with the minimum values allowed. Some exceptional cases are also considered: concretes produced by small volume concretes and samples composed of a number of specimens between 2 ≤ n ≤ 5.
It should be noted that in Brazil, partial sample control is commonly employed in concrete precasting plants, mainly due to the dynamics of production. For concreting in site, the total sampling (100%) is used in buildings, bridges and all the others concrete uses.
As for the control by total sampling (100%), all concretes are sampled and the characteristic compressive strength of the estimated concrete (fck, est ) is given by the value of the compressive strength of the specimen of each concrete, in this case of 100%, the sample is equivalent with the population. It is a control widely used in Brazil in commercial and residential buildings of multiple floors from the validation of ABNT NB-1 in 1978.
As established in section 6.2.2 "Sampling" of the standard ABNT NBR 12655: 2015, each sample must consist of two specimens of the same concrete portion and molded in the same act. The strength of the specimen, for a given rupture age, is the highest of the two values obtained in the compressive strength test, while in general, in others codes the representative value is the mean and not de highest.
The control of the compressive strength of concrete in building structures and infrastructures is an integral part of the introduction of safety in structural design, and its permanent verification throughout the execution of the structure is indispensable (Pacheco & Helene, 2013a), as well as their respective traceability through the appropriate mapping of the concrete launch.
In this paper the results obtained during the control of compressive strength of the concrete realized by total sampling according of ABNT NBR 12655 are presented, as well as comparative analyzes with the control proposed by the American standard ACI 318-14 "Building Code Requirements for Structural Concrete" and European standard EN-206:2013 "Concrete - Specification, performance, production and conformity". To do so, a fck = 40MPa, self-compacting concrete SF 2 spreading class (slump-flow from 660mm to 750mm) was analyzed, according to ABNT NBR 15823:2010 "Self-consolidating concrete. Part 1: Classification, control and acceptance in the fresh state", produced in a single central weighing and mixed in trucks during a period of 2 years and 9 months and applied to the reinforced concrete structures of one commercial tower and two corporates, with 24 to 36 floors, of a large enterprise located in the city of São Paulo.
CONTEXTUALIZATION AND PREMISES
Concrete characteristics and particularities of production
Based on the guidelines of the IBRACON mix design method (Tutikian & Helene, 2011), in the project specifications, available materials and conditions and particularities of the construction an extensive rational and experimental mix design study was carried out to elaborate a self-compacting concrete with fck = 40MPa. This study was developed in accordance with the standards ABNT NBR 12655 and ABNT NBR 15823.
Considering all the mentioned aspects, the concrete detailed in Table 1 was obtained.
| Materials | fck 40MPa |
| ement (CP III-40-RS) | 380kg |
| active silica | 20kg |
| water | 180kg |
| thin sand | 364kg |
| sandstone | 546kg |
| gravel (dimension: 4.5mm – 9.5mm) | 279kg |
| gravel (dimension: 9.5mm - 19mm) | 651kg |
| polyfunctional additive, 0.6% in mass of cement | 2,3kg |
| superplasticizer additive, 1.2% in mass of cement | 4,6kg |
| density of concrete (kg/m3) | 2420 |
| slump flow (ABNT NBR 15823) | SF2 |
| entrained | 0,8 |
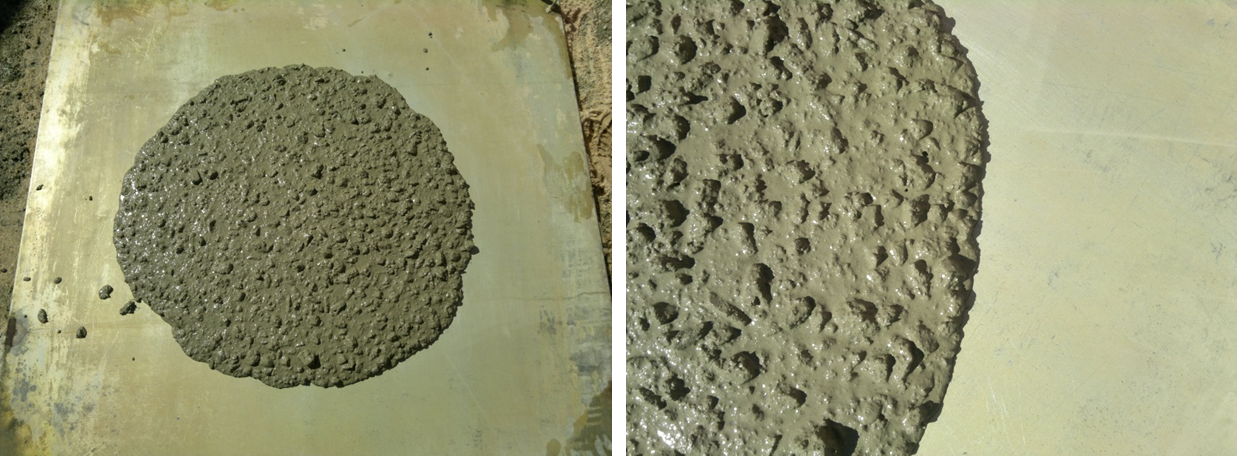
Previously to the use of the concrete, a prototype concreting event was carried out to evaluate the behavior of the concrete studied in the laboratory, under the construction conditions. At the opportunity, it was observed in the field that the amount of superplasticizer additive could be reduced by up to 30%, due to the greater mixing power of the concrete mixer truck and the favorable climatic conditions. Figure 1 shows the visual appearance of the concrete in question, in its fresh state, observed during the execution of the slump flow test carried out during the prototype concreting event.
Considering the satisfactory results obtained in the laboratory and in the prototype event in the field, this concrete was adopted for regular production and was adequate throughout the almost 3-year period considered in this case.
The concrete production was carried out in a ready-mixed concrete equipped with an automated loading system, covered bays and loading point, scales and hydrometers calibrated monthly and availability of six concrete mixer trucks. The ready-mixed concrete was located inside the construction site and produced concrete only and exclusively for the project in question, with a production capacity of up to 70m³ / hour.
As for loading procedures, the brittle, sand, cement, water and polyfunctional additives were added at the loading point of the Plant and the active silica was placed on the conveyor directly on the aggregates to ensure a better homogenization of the final mixture, which was carried out in the truck mixer.
The humidity of the fine aggregates was determined at least 3 times daily using the Chapman vessel (ABNT NBR 9775: 2011 “Fine aggregate - Determination of the superficial humidity by Chapman vessel - Test method”). The humidity obtained was sent to the balance system software of the ready-mixed concrete, which automatically performed the necessary corrections.
After loading the concrete, the superplasticizer additive was added. This addition was carried out in volume, by a professional trained through the use of graduated buckets. On some occasions, 100% ice was used instead of the kneading water (in the case of concretions of large-volume foundation elements). In addition to the ice, as superplasticizer additive and active silica, the control of the added amounts was monitored by extra professionals contracted with the Laboratory responsible for the control of the compressive strength of the concrete (counting of ice bags, silica bags and verification of the volume of additive).
It is important to note that, once outside the ready-mixed concrete, it was not allowed to add water to the concrete, in any case. If there was a need for scattering correction, the superplasticizer additive was added (possibly added to a construction site by a trained professional after authorization by the supervisor and only to correct the fluidity of the fresh concrete).
In this context, the concrete was always supplied with the same mix proportions, by the same ready-mixed concrete plant during a period of 2 years and 9 months. In total, approximately 1,600 concrete mixer trucks were produced, with a maximum of 8m3 each, totaling around 12,000m3 of concrete, or 360m3 / month on average.
Resistance control plan
The control of the compressive strength of the concrete was performed by total sampling regarding the requirements of the standard ABNT NBR 12655 by a Laboratory accredited by INMETRO belonging to the Brazilian Network of Laboratory of Tests, which used qualified laboratories and certified by IBRACON through its Nucleus of Qualification and Certification of Personnel.
The concrete resistance control plan adopted during the entire production process consisted of the molding of four cylindrical specimens with a diameter of 10 cm and a height of 20 cm for each of the concrete mixer trucks being one for compression test at 7 days, two for 28 days and one for 63 days of age.
The specimens were molded in metallic form in a flat place, protected from the weather and later (after a dismantling between 24 h and 36 h), transported in boxes of dry sand to the center of the Laboratory of technological control located at approximately 15 km of the construction site, for seasoning and testing. These were stored in a humid chamber, had their tops prepared by means of grinding, and were tested on periodically calibrated presses in accordance with ABNT NBR 5738: 2015 "Concrete - Procedure for molding and curing concrete test specimens" and ABNT NBR 5739: 2007 ".
RESULTS
Results of compressive strength according of ABNT
The compressive strength of each specimen was determined after rupture of the specimens, according to the requirements of ABNT NBR 5739.
Figure 2 shows the chart of individual compressive strength values of concrete at 28 days of age, histogram and corresponding normal distribution. The axis of the abscissae presents the copies in chronological order and, the axis of the ordinates, the values of resistance to compression of each of the copies (the greater resistance obtained in the rupture of two test specimens, according to established in ABNT NBR 12655).
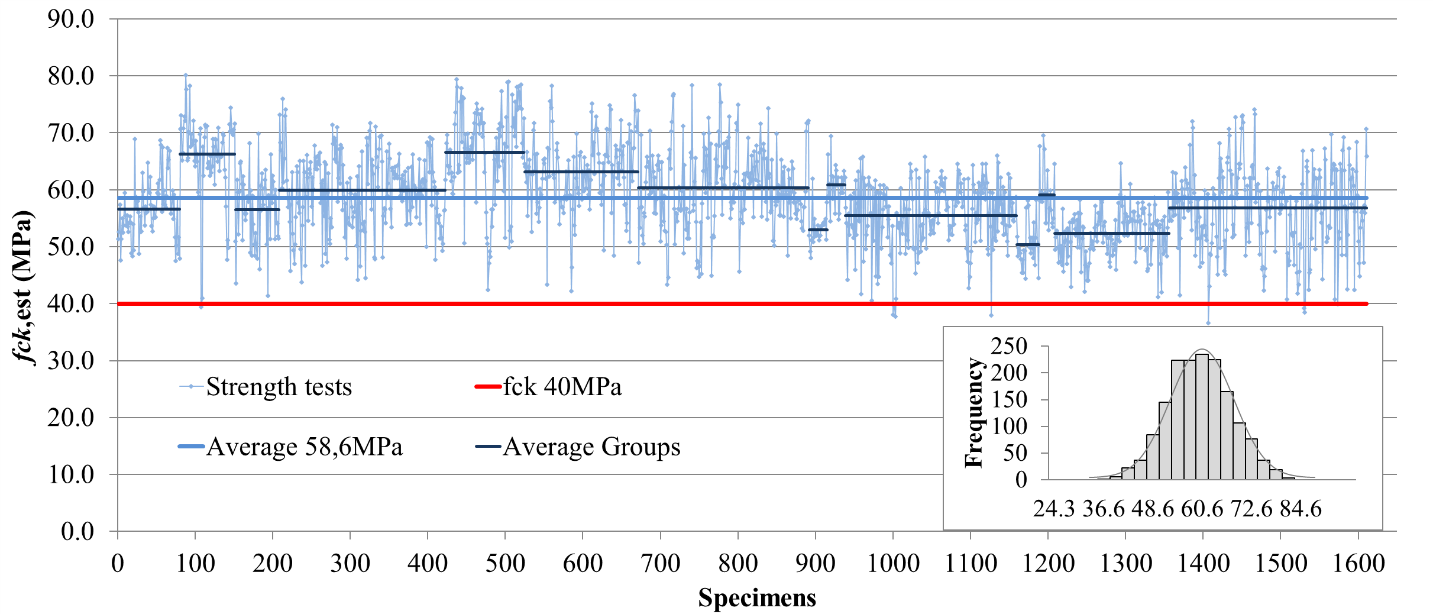
The chart features about 1,600 compressive strength results obtained over 2 years and 9 months. These results ranged from 36.6 MPa to 80.1 MPa, with a mean of 58.6 MPa, the lowest value being equivalent to 0.91 * fck . Eleven results were found below the specified design strength (fck = 40MPa), or about 0.7% of the total truck load. In a normal distribution (Gaussian curve) the defective quantile would correspond to a coefficient of 2.46.
The variability of the compressive strength of the same concrete mix proportion can oscillate around different values, because in the course of the production process changes of centering take place, mainly due to different sets of cement and aggregates.
Considering the concept of characteristic strength of the concrete described in section 12.2 “Characteristic values” of ABNT NBR 6118: 2014 “Design of structural concrete – Procedure”, the value of the compressive strength of this concrete, obtained directly from the population, would be fck ,5% = 46.5MPa. The standard deviation of the production and test operations obtained was sc = 6.6MPa and the coefficient of variation Vc = 11.2%.
The characteristic strength of this concrete adapted from the ABNT NBR 12655 partial sampling criterion would be fck,est = fcm - 1.65 * sc = 47.7MPa, although in this case it is only a mathematical speculation , since the effective criterion to be used should be 100% total sampling.
Evaluation of the control of the production process
According to section 7 “Process analysis” of ABNT NBR 7212: 2012 “Ready-mixed concrete – Procedure” the evaluation of process control should be performed based on the standard deviation, as presented in Table 2.
| Place of production | Standard deviation (MPa) | |||
| Level 1 | Level 2 | Level 3 | Level 4 | |
| Plant | s ˂ 3,0 | 3,0 ˂ s ˂ 4,0 | 4,0 ˂ s ˂ 5,0 | s > 5,0 |
Thus, through the analysis of the standard deviation and the criteria recommended by ABNT NBR 7212: 2012, it is a Level 4 Plant.
According to the parameters currently established by ABNT NBR 12655, this standard deviation of the production is high and not compatible with production of concrete in plant, class A. On the other hand, the standard ABNT NB-1 of 1960, considered that production of concrete with a standard deviation equal to or lower than 15% should be classified as strict production, that is, it would correspond to the best classification at the time.
According to ACI 214 section 4.5 “Standards of control”, for concrete of fck ≥ 35MPa (case in question), the coefficient of variation (Vc ) is the parameter that must be used to qualify or classify the concrete production presented in Table 3, in which case the production can be classified with good / reasonable accuracy.
| Production | Coefficient of variation | ||||
| Excellent | Very good | Good | Fair | Faulty | |
| Construction site | ˂ 7,0% | 7,0% a 9,0% | 9,0% a 11,0% | 11,0% a 14,0% | > 14,0% |
| Laboratory | ˂ 3,5% | 3,5% a 4,5% | 4,5% a 5,0% | 5,0% a 7,0% | > 7,0% |
Influence of testing and control operations
The 28-day compressive strength results were analyzed from the point of view of the influence of the test and control operations according to the criteria recommended by the American Concrete Institute in the ACI-214R-11 “Guide to Evaluation of Strength Test Results of Concrete”.
This methodology consists of the calculation of the standard deviation and the coefficient of variation due to the test and control operations, based on the result of the compressive strength of sibling specimens and later comparison with the control criteria suggested in Chapter 4 “Analysis of Strength Data” which states the following:
a) Calculation of the standard deviation of test and control operations:
se : the standard deviation of the test operations in MPa;
n: number of specimens considered to be composed of specimens (not less than 10 specimens);
A: difference between the largest and smallest result of specimens representing the same specimen;
d2: coefficient depending on the number p of representative specimens of the same specimen, according to Table 4.
| Number p of specimens | d2 |
| 2 | 1,128 |
| 3 | 1,693 |
| 4 | 2,059 |
b) Calculation of the coefficient of variation or variability of the test and control operations:
se : the standard deviation of the test operations in MPa (value obtained in item a);
Ve : coefficient of variation due to test and control operations (%);
fcmj : mean of all results used, j days old, in MPa.
c) Determination of the Control Standard, according to Table 5:
| Production | Coefficient of variation | ||||
| Excellent | Very good | Good | Fair | Faulty | |
| Construction site | ˂ 3,0% | 3,0% a 4,0% | 4,0% a 5,0% | 5,0% a 6,0% | > 6,0% |
| Laboratory | ˂ 2,0% | 2,0% a 3,0% | 3,0% a 4,0% | 4,0% a 5,0% | > 5,0% |
Considering the difference in compressive strength between the two fractured specimens ruptured at 28 days of age, the results obtained throughout the concrete production period indicated a standard deviation of the test and control operations (se ) varying from 0.6MPa to 1.0MPa and coefficient of variation due to the test and control (Ve ) operations between 1.1% and 1.6%.
According to the limits recommended by ACI 214, all the results pointed to a standard of control of the operations of test, in construction site, excellent. On the other hand, it is observed that the results obtained are more rigorous than the tests performed in experimental research conducted in the laboratory, which is not common.
Comparative analysis between the control methods proposed by ABNT and ACI
As previously detailed, the control of the compressive strength of the concrete was performed by total sampling in accordance with the requirements of ABNT NBR 12655. However, when the compressive strength values of the same concrete production are analyzed according of ACI 318 judgment does not match. This is justified because the sampling procedures, as well as the acceptance criteria prescribed by the ACI, are different from the model adopted by the ABNT.
one per day of concreting;
one for each 115m3 of concrete produced;
one per 465m2 of surface area for slabs or walls;
the control for volumes lower than 38m3 is dispensed, provided that there is an approved concrete.
According to ACI 318, the value of the compressive strength of each of the specimens is determined by the simple arithmetic mean of the results obtained. According to ASTM C39-16b “Standard Test Method for Compressive Strength of Cylindrical Concrete Specimens”, if the individual values of the specimens differ by more than 8%, the results are inadequate, and the test should be repeated. The ACI 318, as well as ABNT NBR 12655 and the European standard EN-206: 2013 “Concrete - Specification, performance, production and conformity” also consider that of each mixed concrete only one compressive strength value is obtained.
for fck ≤ 35MPa, no individual result shall be less than fck - 3,5MPa;
for fck > 35MPa (case in question), no individual result can be less than 0,9 * fck ;
the average of any three consecutive results shall be equal to or greater than the characteristic resistance defined in the design (fck).
Thus, in order to perform a comparative analysis between the controls performed by ABNT and ACI, all values of compressive strength obtained at 28 days of age were also treated and organized according to the sampling and acceptance criteria proposed by ACI 318, as shown below.
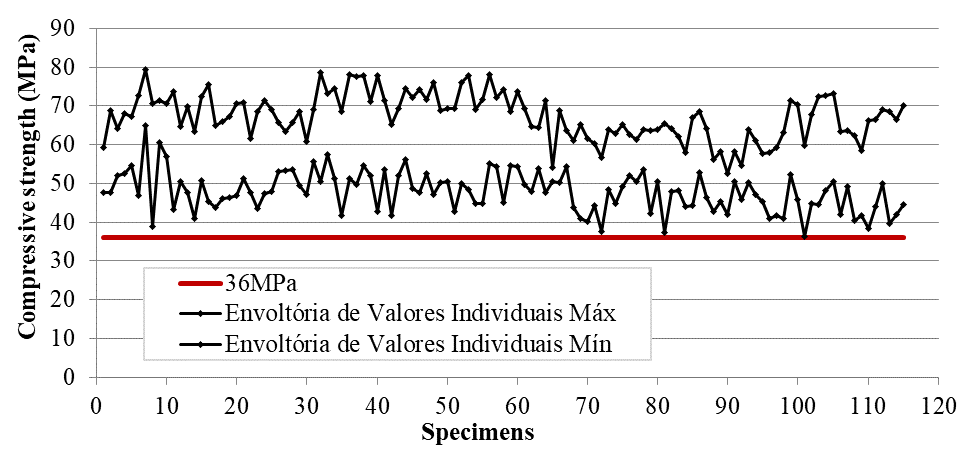
Considering the minimum sampling criterion proposed by the ACI of one specimen per 115m3 of concrete (1 molding of specimens for each 14 truck mixer of 8m3), it became possible to analyze numerous combinations of results, since they were molded test bodies for all concrete mixer trucks (population). Thus, to study all possibilities, the envelope of the individual values and the moving average of 3 (three) consecutive results (maximum and minimum values assumed) were determined.
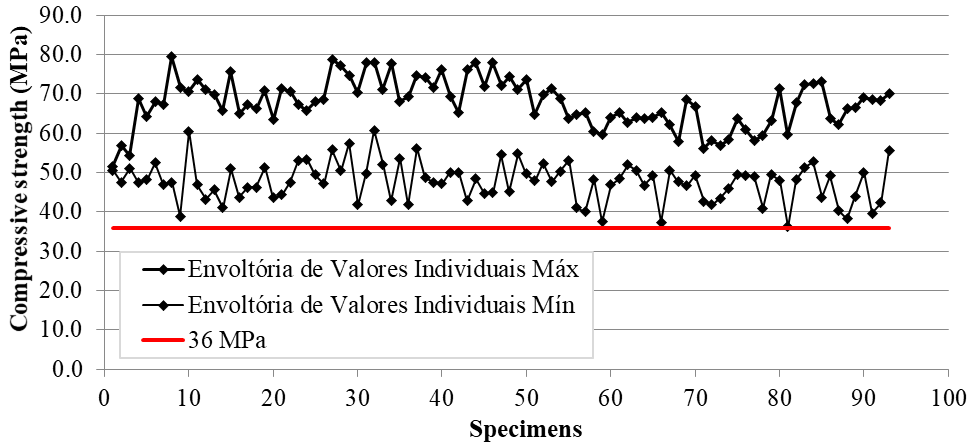
According to the criterion recommended by ACI 318, all individual values must be greater than 36MPa (0.9 * fck ). It is observed in Figure 3 (envelope of the individual values) that, before all possibilities, no value is less than 36MPa (it should be noted that the lowest individual mean value recorded was 36.2MPa). Therefore, this criterion of acceptance was always met.
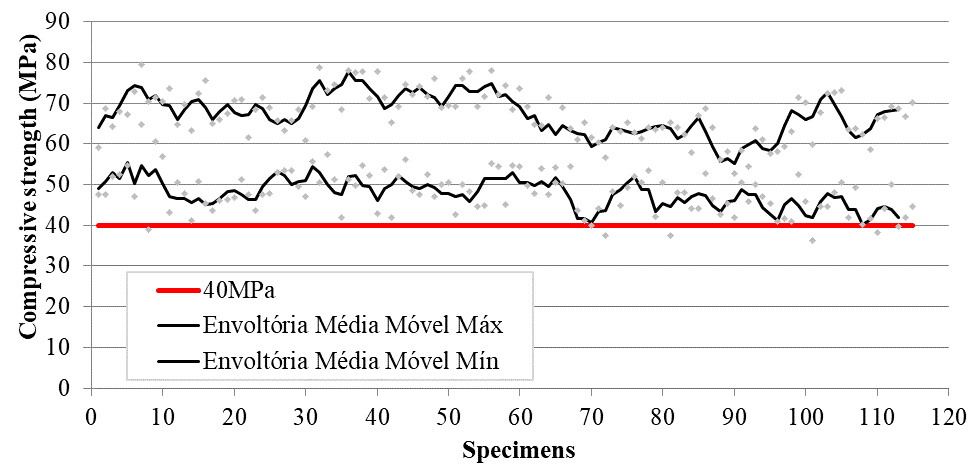
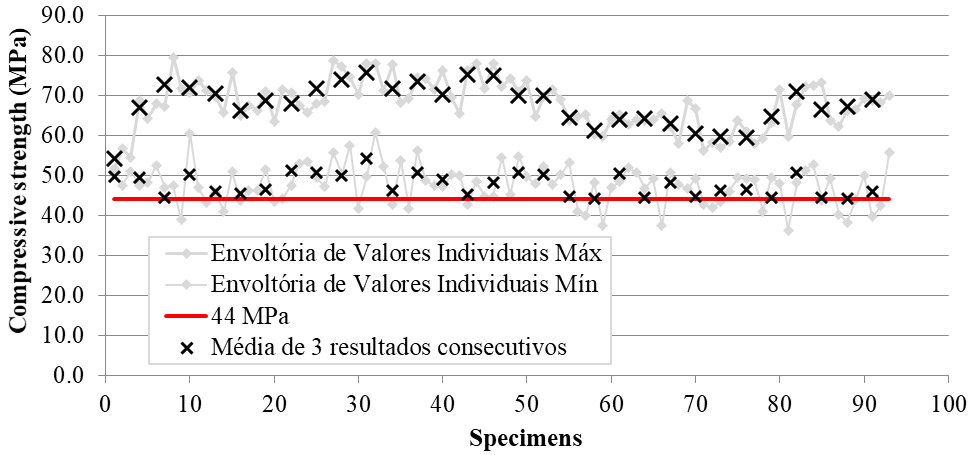
According to the ACI, to ensure acceptance of the concrete, another type of analysis must be done. In Figure 4 is presented the envelope of the moving average over the entire production period [maximum and minimum values of any 3 (three) consecutive results]. Note that in no case the moving average was less than the characteristic resistance defined in design (40MPa). The lowest recorded value was 40.1 MPa. Therefore, regardless of the combination of results considered, this criterion of acceptance was also met.
Therefore, considering the most unfavorable scenario, if the technological control of the concrete were performed according to ACI 318, there would be no non-conformities since both criteria (individual values and average) were always satisfied simultaneously.
Comparative analysis between control methods proposed by ABNT and EN
Like the American standard, the European code EN 206 establishes 2 (two) criteria for analysis of the concrete compressive strength conformity: criterion for individual results and criterion for average results.
In the case of analysis by means of the individual criterion, each result must satisfy the following condition: any individual value must be ≥ fck - 4MPa.
method A or control of the initial production. In this case, the average strength of 3 (three) consecutive results should be ≥ fck + 4MPa, and the compliance criteria were developed based on non-overlapping test results. Therefore, the application of overlapping criteria (consecutive results moving average) increases the risk of rejection;
method B or continuous production control. This is an option when continuous production criteria are established, when at least 35 (thirty-five) test results are available within a 3 (three) month period. According to this method, the average of 15 (fifteen) or more consecutive results [made available in a period not exceeding 3 (three) months] should be ≥ fck + 1.48 * σ (adopting as σ the standard deviation determined at the end of the start of production control).
The EN 206 still allows the conformity of the compressive strength of the concrete to be evaluated using control charts (method C), provided that the conditions of continuous production are established and that it is certified by third parties, which is not the case.
As for the formation of lots, when continuous production is carried out in concrete plants with production control certification, samples should be taken every 200 m3 (or one every 3 days of production). If concrete production does not have production control certification (case in question), samples should be taken out every 150 m3 (or one per day of production). Important: in the first 50 m3 of production, at least 3 samples must be taken.
It is valid to record that this standard allows a copy of the value obtained from a single specimen or, in case of more breaks, the result is defined as the average value. Individual results that deviate more than 15% from the average value should be disregarded.
Similarly to the case discussed previously (ACI), since molded concrete specimens were used for all concrete mixer trucks, in the case of EN, it was also possible to carry out an analysis considering numerous combinations of results.
According to the minimum sampling criterion proposed by the EN of 3 (three) specimens in the first 50 m3 of production and, subsequently, 1 (one) specimen per 150 m3 of concrete (1 molding of specimens at each 18 concrete mixer trucks of 8 m3), the individual value envelope shown in Figure 5 was obtained.
It is noted that during the production period the criterion of individual values recommended in section 8.2.1.3.1 “Criteria for individual results” of EN 206: 2013 was met in all cases. Again, it is worth remembering that the lowest value of compressive strength obtained in this period was 36.2 MPa, considering the average of two (2) sibling specimens.
As to the analysis of the average results, in order to contemplate all possibilities, we considered the envelope of the mean values of 3 (three) non-overlapping consecutive results, as evidenced in Figure 6.
It is worth noting that, as in the case of the individual values curve, the mean value curve obtained during the whole production period has always met the requirements established in section 8.2.1.3.2 “Criteria for mean results” of EN 206: 2013. In this case, the lowest value was 44.1 MPa, that is, higher than the criterion ≥ fck + 4MPa = 44MPa.
The safety criteria of the structures established in the European standard are different from the criteria adopted by the American and Brazilian standards, since they involve probability of rupture, characteristic values of actions and different resistances. Therefore, it is reasonable to expect that the values of compressive strength obtained in this case are somewhat different from the previous cases.
CONCLUSIONS
The control of compressive strength of the concrete recommended by the Brazilian standard is very strict and the safest. Sampling is 100% total (population) and the results are analyzed individually, without tolerances. Any resistance value that is lower than the project specification will be considered non-compliant. However, although very safe, it is a costly control because it involves molding, handling, transportation, curing, grinding and breaking of many concrete specimens of all concrete mixer trucks received on site (total sample control).
It is noted that the control methodology prescribed by ACI 318 and EN 206 is much milder when compared to the criteria of the Brazilian standard. In these standards the control is not performed by total sampling, tolerances are established for the individual values of compressive strength and, in addition, the concept of the average of consecutive results is also applied as criterion of acceptance.
In the opinion of the authors of this paper, the acceptance and compliance criteria recommended by ABNT NBR 12655 are demanding and it would be advisable to flex the value of individual results within a margin of up to 0.9 * fck . On the other hand, the sampling criterion adopted in Brazil is in favor of safety and in the opinion of these authors, although onerous, it should be maintained as it stands.
In this case, the results obtained through the technological control prescribed by ABNT NBR 12655 pointed to a non-conformity index related to the compressive strength of 11-fold concrete in approximately 1,600 concrete mixer trucks (0.7%). This unimportant nonconformity generated absolutely unnecessary wear and design revisions. On the other hand, the same results, when analyzed in the light of the methodologies prescribed by ACI 318 and EN 206, indicated a zero-non-compliance index.
Adopting flexibilization and accepting a few individual values of up to 0.9 * fck as conforming would certainly impact positively on the production process, minimizing possible costs, rework, project reviews, delays in work schedules and unnecessary wear and tear among stakeholders of the concrete production chain, without compromising the safety, durability and final quality of the concrete structures.
REFERENCES
ABNT - Associação Brasileira de Normas Técnicas (2015), NBR 12655: Concreto de cimento Portland – Preparo, controle, recebimento e aceitação – Procedimento, Associação Brasileira de Normas Técnicas, p. 23.
ABNT - Associação Brasileira de Normas Técnicas (2014), NBR 6118: Projeto de estruturas de concreto – Procedimento, Associação Brasileira de Normas Técnicas, p. 238.
American Concrete Institute (2011), ACI 214R-11: Guide to Evaluation of Strength Test Results of Concrete, American Concrete Institute, p. 16.
American Concrete Institute (2014), ACI 318-14: Building Code Requirements for Structural Concrete, American Concrete Institute, p. 524.
ASTM International. (2016). ASTM C39/C39M-16b Standard Test Method for Compressive Strength of Cylindrical Concrete Specimens. Retrieved from https://doi.org/10.1520/C0039_C0039M-16B
EN 206 (2013), Concrete – Specification, performance, production and conformity, European Committee for Standardization, p. 93.
Pacheco J. & Helene P. (2013), Controle da resistência do concreto - 1ª Parte, Revista Concreto e Construções n. 69, pp 75 - 81.
Pacheco J. & Helene, P. (2013), Controle da resistência do concreto - 2ª Parte, Revista Concreto e Construções n. 70, pp 90 - 98.
Tutikian B. & Helene P. (2011), Dosagem dos Concretos de Cimento Portland. In: Geraldo C. Isaia (Org). Concreto: Ciência e Tecnologia. 1 ed. São Paulo: Ibracon, v. 1, pp 415 - 451.
Author notes
paulo.helene@concretophd.com.br
Additional information
Cite as: R. Boni,
C. Britez, P. Helene (2018), "Concrete strength control: ABNT, ACI and EN
comparative procedures. Site study case.", Revista
ALCONPAT, 8 (3), pp. 333-346, DOI: http://dx.doi.org/10.21041/ra.v8i3.303
Legal Information: Revista ALCONPAT is a quarterly publication by the Asociación Latinoamericana de Control de Calidad,
Patología y Recuperación de la Construcción, Internacional, A.C., Km. 6 antigua
carretera a Progreso, Mérida, Yucatán, 97310, Tel.5219997385893, alconpat.int@gmail.com,
Website: www.alconpat.org
Responsible editor: Pedro
Castro Borges, Ph.D. Reservation of rights for exclusive use
No.04-2013-011717330300-203, and ISSN 2007-6835, both granted by the Instituto
Nacional de Derecho de Autor. Responsible for the last update of this issue,
Informatics Unit ALCONPAT, Elizabeth Sabido Maldonado, Km. 6, antigua carretera a Progreso, Mérida, Yucatán, C.P. 97310.
The views of the authors do
not necessarily reflect the position of the editor.
The total or partial
reproduction of the contents and images of the publication is strictly
prohibited without the previous authorization of ALCONPAT Internacional
A.C.
Any dispute, including the
replies of the authors, will be published in the second issue of 2019 provided
that the information is received before the closing of the first issue of 2019.