
Investigación Aplicada
Evaluation of the ultrasound test for estimating the depth of cracks in concrete
Avaliação do ensaio de ultrassom para a estimação da profundidade de fissuras em concreto
Evaluación del ensayo de ultrasonido para la estimación de la profundidad de fisuras en concreto
Evaluation of the ultrasound test for estimating the depth of cracks in concrete
Revista de la Asociación Latinoamericana de Control de Calidad, Patología y Recuperación de la Construcción, vol. 9, no. 1, 2019
Asociación Latinoamericana de Control de Calidad, Patología y Recuperación de la Construcción, A. C.
Received: 08 January 2018
Accepted: 18 October 2018
Published: 30 December 2018
Abstract: The objective of this study is to evaluate the ultrasound test to estimate the depth of cracks in concrete, using a mathematical model published in the literature, and to verify this depth with more accurate results. Four concrete test specimens were molded for each proposed crack depth (5 cm, 10 cm, and 15 cm), simulated using zinc plates, placed during molding and removed before concrete hardening. The results show that the test is sensitive enough to detect the presence of the cracks in the concrete. The mathematical model used allowed for an estimation of the depths of most cracks, but the results are scattered and have a high margin of error for the depths of 5 cm and 15 cm. The cracks of 10-cm depth produced better results.
Keywords: ultrasound test, cracks, concrete.
Resumo: Este trabalho teve como objetivo avaliar o ensaio de ultrassom para estimar a profundidade de fissuras em concreto, utilizando modelo matemático da literatura, também verificar a profundidade com melhores resultados. Foram moldados 4 prismas de concreto para cada profundidade de fissura proposta (5 cm, 10 cm e 15 cm), simuladas através de chapas de zinco, colocadas durante a moldagem e retiradas antes do concreto endurecer. Os resultados mostram que o ensaio é sensível para detectar a presença de fissuras no concreto. O modelo matemático utilizado permitiu estimar a maioria das profundidades de fissuras; mas, os resultados apresentam-se dispersos e com margem de erro elevada para as profundidades de 5 cm e 15 cm, já para 10 cm apresentou melhores resultados.
Palavras-chave: ultrassom, fissuras, concreto.
Resumen: Este trabajo tuvo como objetivo evaluar el ensayo de ultrasonido para estimar la profundidad de fisuras en concreto, utilizando un modelo matemático de la literatura, además de verificar la profundidad con mejores resultados. Se moldearon 4 prismas de hormigón para cada profundidad de fisura propuesta (5 cm, 10 cm y 15 cm), simuladas a través de chapas de zinc, colocadas durante el moldeado y retiradas antes de que el hormigón endurezca. Los resultados muestran que el ensayo es sensible para detectar la presencia de fisuras en el hormigón. El modelo matemático utilizado permitió estimar la mayoría de las profundidades de fisuras; pero los resultados se presentan dispersos y con un margen de error elevado para las profundidades de 5 cm y 15 cm, ya que para 10 cm presentó mejores resultados.
Palabras clave: ultrasonido, fisuras, concreto.
INTRODUCTION
Cracks are the most common pathological manifestations found in concrete structures, usually appearing as a result of tensile stresses, which concrete has difficulty absorbing. Among the types of cracks that occur are those caused by thermal phenomena or by shrinkage (which are not structural hazards but may compromise sealing and performance), and those due to the lack of capacity of the structure to absorb tensile stresses, either by underestimation of the forces during sizing or by decrease of the material strength, the latter being of concern according to Silva Filho and Helene (2011). The timely detection of these defects can prevent rapid deterioration and extend the useful life of the structures (Aggelis et al., 2010).
The evaluation of structures is usually performed through visual inspection, the results of which can be subjective because they depend on the experience of the inspector (Rocha and Póvoas, 2017). However, there are several non-destructive tests (NDTs) that allow for important information about concrete properties to be extracted (Rehman et al., 2016), and are usually used to locate and evaluate defects in hardened concrete (Lorenzi et al., 2016). Lee, Chai, and Lim (2016) consider that available methods for evaluating concrete cracks have their own limitations. The most commonly used NDT techniques for inspection of concrete structures are: ultrasound (Aggelis et al., 2010), thermography (Bagathiappan et al., 2013), pachymetry (Maran et al., 2015), radar (Dabous et al., 2017), and sclerometry (Tomazeli and Helene, 2017).
The ultrasound test can determine the modulus of elasticity and specific mass of the concrete (Pacheco et al., 2014), estimate the compressive strength with a reasonably good approximation (Bungey, Millarde Grantham, 2006), and locate and determine the size of discontinuities in the structure (Menezes et al., 2016).
Several studies have been undertaken to detect cracks and fissures in concrete using the ultrasound test (Aggelis et al., 2010; Wolf, Pirskawetz, and Zang, 2015) and others to estimate their depth (Bungey, Millard, and Grantham, 2006; Pinto et al., 2010; Souza, 2016). The study developed by In et al. (2017) used the diffuse ultrasound technique to estimate the depth of cracks in concrete pieces that simulated real beams, performing a two-dimensional simulation of finite elements. This study concluded that it is possible to estimate the depth of cracks with deviations of 1 cm in relation to the real central measurement. Seher et al. (2013) also used diffuse ultrasound combined with two-dimensional finite element simulations, for which they analyzed the wave parameters to verify the variations between cracked and uncracked elements. It can be concluded that it is possible to estimate the depth of cracks with a maximum error of 10%.
It has been demonstrated in all the studies that the results are influenced by several factors, such as: crack depth, concrete quality, and material saturation, among others. The objective of the present article is to evaluate the ability of ultrasound method to estimate the depth of cracks in concrete structures and specifically the influence of the depth of the cracks on the results, by analyzing the time variation of the sound wave through the cracked and uncracked areas.
ULTRASOUND TEST PROCEDURE
The ultrasound equipment used for concrete is designed to generate longitudinal waves, also known as sound waves (Bungey, Millard, and Grantham, 2006). Those whose frequency falls within the range of 20Hz to 20,000Hz are audible to the human ear, whereas the waves below 20Hz are called infrasonic and those above 20,000Hz are known as ultrasonic. (Possani et al., 2017).
The results obtained from the test may be affected by several factors, such as the distance between the contact surfaces of the transducers; the presence of reinforcement, especially if aligned in the direction of wave propagation; the specific concrete mass, which depends on the concrete mixture and conditions; the type, specific mass and other characteristics of the aggregate; the type of cement and degree of hydration; the densification type; and the age of the concrete (Pacheco et al., 2014, Lorenzi et al, 2013, Mohamad et al., 2015).
There are several advantages to using ultrasonic tests on concrete structures, such as: the tests are non-destructive, the equipment is cheap and easy to operate, and the test can be applied at any time, as it will not contribute to deterioration of the structure. However, the test does have some limitations, because the interpretation of its results is merely qualitative in relation to the quality of the concrete. It is therefore necessary to use it in conjunction with other tests in order to obtain more conclusive results (Aggelis et al. al., 2010).
Ultrasound tests in Brazil are regulated by NBR 8802 - Hardened concrete - Determination of the propagation of ultrasonic waves (ABNT, 2013). According to this standard, there are three ways for waves to be transmitted along the surface of the concrete: direct, semidirect, and indirect, as shown in Figure 1.

METHODOLOGY
To achieve the objectives of this study, concrete blocks were molded to represent real structural elements, in which cracks were induced to estimate depths using the mathematical model proposed by Bungey, Millard, and Grantham (2006). A total of 12 concrete blocks were molded, four for each of the three proposed crack depths (5 cm, 10 cm, and 15 cm). Four distances between the transducers were considered when performing the test (10 cm, 20 cm, 30 cm, and 40 cm).
To facilitate the analysis of the results, the blocks were divided into three groups (series) according to the crack depth: Series I - blocks with 5 cm deep cracks; Series II - blocks with 10 cm deep cracks; and Series III - blocks with 15 cm deep cracks.
The equipment used was the 58-E4800 UPV, with a standard frequency of 54 KHz using 50-mm diameter transducers (CONTROLS GROUP, 2017).
Test specimens
The concrete blocks had dimensions of 20 x 20 x 50 cm. The crack was induced along the axis of the block by placing a 0.95 mm thick zinc plate during the molding, which was then removed before the concrete hardened. All the blocks were produced with the same depth, because research in the literature showed no influence on the results caused by the depth. Figure 2 shows the details of these test specimens.

The water/cement ratio used was 0.5 and the mixture (cement:gravel:sand) was 1:1.46:2.51. The cement used was CPII Z-32. The gravel and sand were tested according to standard NBR 7211 (ABNT, 2009), where the granulometric distribution met the recommended limits and the maximum diameter of the gravel was 19 mm.
For the number of blocks used in the study to be statistically representative for the analysis of results, it is important that the observations of the independent variables are in a proportion greater than 5 to 1, that is, more than 5 observations for each independent variable. The recommended level is between 15 and 20 observations per variable, so that the sample can be considered representative (Hair et al., 2009). This study analyzed two independent variables, crack depth and test execution distance. When multiplied by 20, this gives an ideal quantity of 40 observations. In total, 96 observations were performed (4 blocks x 3 depths x 4 distances x 2 repetitions), a value well above the recommended amount.
Mathematical model for estimating crack depth proposed by Bungey, Millard, and Grantham (2006)
The model allows for the estimation of crack depth perpendicular to the concrete surface when the mode of transmission is indirect. Therefore, the transducers should be placed equidistant from the crack, as shown in Figure 3 (a) and (b).

In order to apply this model, the velocity of the ultrasonic wave through the integral concrete obtained using the indirect mode should be adopted as "Vc". That is, a speed "Vc" is found in a region of the concrete without cracks, having Y = 2X between the transducers.
Considering that the wave will deviate around the crack and that the velocity should remain the same because it is propagating through similar material, it is possible to estimate the depth of a crack that has its axis located at distance "X" from the transducers, as shown in Figure 3. The difference between these two paths will cause a slower wave propagation time, because the speed "Vc" should be the same.
The model assumes that the velocity will be equal for the two paths and that the wave will deviate because it is a mechanical wave, which requires a medium through which to propagate. Equation (1) represents the proposed mathematical model, a result of the equality of velocities along the two wave paths.
h = crack depth estimated by the model (cm);
x = distance from the transducer to the axis of the crack (cm);
Tc = wave propagation time through unbroken whole concrete, defined as (2).
Tf = wave propagation time around the crack, defined as (3).
Test execution
The ultrasound test was performed using the indirect mode, avoiding roughness on the tested surface as indicated by NM-58 (ABNT, 1996). The calibration of the equipment was performed before beginning the measurements, according to the procedure described in the manual (CONTROLS GROUP, 2017).
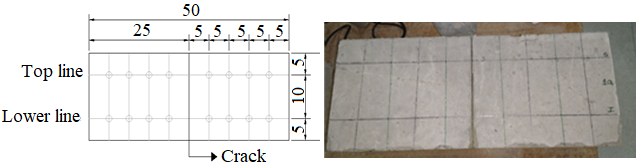
An observation grid was marked on the surface used for the test, composed of an upper and lower line, the detail of which is shown in Figure 4. At all points where measurements were to be taken, Vaseline was applied to connect the transducer to the surface.
At each grid point, two readings were performed using the ultrasound and their average was used for the calculations of the model.
Standard NBR 8802 (ABNT, 2013) provides guidelines for obtaining the velocity of wave using the indirect mode, where the emitting transducer is at a fixed point and the receiving transducer is shifted at predetermined distances. With the data obtained, a time versus distance graph can be plotted to draw the line that best fits the points, with the tangent of the line being the wave velocity.
In order to apply the Bungey, Millard, and Grantham (2006) model, it is necessary to obtain the propagation time of the wave using the indirect mode in intact concrete - Tc, which must be obtained for the same distances that are to be measured in the cracked region - Tf.
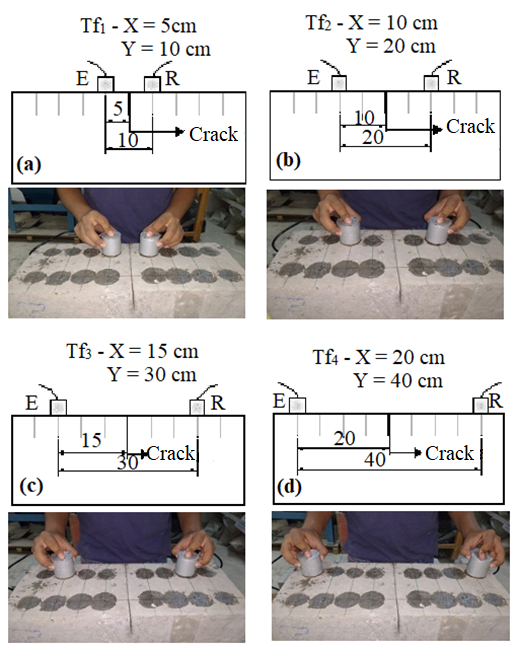
To obtain Tc, the emitting transducer was fixed at the first point of the mesh and the receiving transducer was moved in 5-cm steps, obtaining times for the distances Y = 5cm, 10cm, and 15cm, according to Figure 5 (a), (b), and (c), where E is the transmitter, R is receiver, and Y is the distance between transducers (cm).
The results of the three readings of distance (cm) versus time (μs) were plotted to obtain the best fit line (Figure 6) and to find the propagation times through intact concrete, adjusted by the line Tc' for all distances required to apply the model: Y = 10cm, 20cm, 30cm, and 40cm, as shown in Table 1, which presents the results of the first repetition for the first test specimen of Series II. The measurements are identified first by the number of the block in the series (1, 2, 3, or 4), then by the depth (P5 = 5cm, P10 = 10 cm, P15 = 15 cm), followed by the test execution distance D10 = 10 cm, D20 = 20 cm, D30 = 30 cm, D40 = 40 cm) and finally by a unique number for each repetition of the test (1 for the first and 2 for the second).


| Adjusted time - Tc' (μs) - Series II - block I | ||||
| Identification | Tc (μs) | Y (cm) | Tc' (μs) | |
| 1P10D5-1 | 23.45 | 5.00 | 22.49 | |
| 1P10D10-1 | 35.88 | 10.00 | 37.52 | |
| 1P10D15-1 | 53.23 | 15.00 | 52.54 | |
| 1P10D20-1 | - | 20.00 | 67.56 | |
| 1P10D30-1 | - | 30.00 | 97.61 | |
| 1P10D40-1 | - | 4000 | 127.66 | |
| Linear Equation | Y = 0.3328X – 2.4862 | |||
| Y-intercept | -2.4862 | |||
| "Vc"(cm/μs) - Angular coef. | 0.3328 | |||
The adjusted times (Tc’) were found for the distances Y = 10cm, 20cm, 30cm, and 40cm, where Y = 2X, with X being the distance between the axis of the crack and the transducer.
In order to measure the propagation time of the wave around the crack (Tf), the readings were taken with distances between the transducers of Y = 10 cm, 20 cm, 30 cm, and 40 cm, as shown in Figure 7 (a) (b) (c) (d).
Once the values for Tc' and Tf have been obtained for the same distances, it is possible to estimate the depth of the crack using the model proposed by Bungey, Millard, and Grantham (2006), following the procedure presented in the previous section.
The procedure shown for obtaining the Tc' and Tf values was repeated two times for each of the four concrete blocks per series, for all three series.
ANALYSIS AND DISCUSSION OF RESULTS
A statistical analysis was performed with the results for the crack depths (h') for Series I, II, and III found by the application of the mathematical model proposed by Bungey, Millard, and Grantham (2006), in order to verify which series presented the most significant results.
| CRACK DEPTH h' | |||||
| Series I | Series II | Series III | |||
| Identification | h' (cm) | Identification | h' (cm) | Identification | h' (cm) |
| 1P5D10-1 | 5.68 | 1P10D10-1 | 6.71 | 1P15D10-1 | 10.43 |
| 1P5D20-1 | 6.34 | 1P10D20-1 | 9.82 | 1P15D20-1 | 12.27 |
| 1P5D30-1 | 11.20 | 1P10D30-1 | 11.22 | 1P15D30-1 | 10.51 |
| 1P5D40-1 | 11.15 | 1P10D40-1 | 9.78 | 1P15D40-1 | 7.23 |
| 2P5D10-1 | 3.82 | 2P10D10-1 | 6.05 | 2P15D10-1 | 24.40 |
| 2P5D20-1 | 4.00 | 2P10D20-1 | 7.15 | 2P15D20-1 | 19.57 |
| 2P5D30-1 | 7.35 | 2P10D30-1 | * | 2P15D30-1 | 24.56 |
| 2P5D40-1 | 3.12 | 2P10D40-1 | * | 2P15D40-1 | 21.86 |
| 3P5D10-1 | 4.43 | 3P10D10-1 | 5.63 | 3P15D10-1 | 11.10 |
| 3P5D20-1 | 3.08 | 3P10D20-1 | 7.74 | 3P15D20-1 | 15.79 |
| 3P5D30-1 | 9.13 | 3P10D30-1 | 6.64 | 3P15D30-1 | 14.64 |
| 3P5D40-1 | 14.97 | 3P10D40-1 | 11.60 | 3P15D40-1 | 11.08 |
| 4P5D10-1 | 3.32 | 4P10D10-1 | 6.22 | 4P15D10-1 | 9.56 |
| 4P5D20-1 | 4.05 | 4P10D20-1 | 8.70 | 4P15D20-1 | 9.19 |
| 4P5D30-1 | 3.20 | 4P10D30-1 | 5.11 | 4P15D30-1 | 5.92 |
| 4P5D40-1 | 10.62 | 4P10D40-1 | 7.35 | 4P15D40-1 | * |
| 1P5D10-2 | 4.82 | 1P10D10-2 | 6.38 | 1P15D10-2 | 12.21 |
| 1P5D20-2 | 3.74 | 1P10D20-2 | 4.96 | 1P15D20-2 | 14.95 |
| 1P5D30-2 | 15.17 | 1P10D30-2 | * | 1P15D30-2 | 10.25 |
| 1P5D40-2 | 15.21 | 1P10D40-2 | * | 1P15D40-2 | 7.94 |
| 2Z5D10-2 | 3.08 | 2P10D10-2 | 7.01 | 2P15D10-2 | 25.73 |
| 2P5D20-2 | * | 2P10D20-2 | 5.98 | 2P15D20-2 | 22.01 |
| 2P5D30-2 | 5.88 | 2P10D30-2 | * | 2P15D30-2 | 27.28 |
| 2P5D40-2 | 9.00 | 2P10D40-2 | * | 2P15D40-2 | 26.97 |
| 3P5D10-2 | 4.70 | 3P10D10-2 | 6.58 | 3P15D10-2 | 13.64 |
| 3P5D20-2 | 3.93 | 3P10D20-2 | 5.27 | 3P15D20-2 | 14.70 |
| 3P5D30-2 | 9.04 | 3P10D30-2 | * | 3P15D30-2 | 15.80 |
| 3P5D40-2 | 10.59 | 3P10D40-2 | * | 3P15D40-2 | 11.59 |
| 4P5D10-2 | 2.67 | 4P10D10-2 | 8.19 | 4P15D10-2 | 14.19 |
| 4P5D20-2 | * | 4P10D20-2 | 9.54 | 4P15D20-2 | 16.19 |
| 4P5D30-2 | 6.48 | 4P10D30-2 | 7.61 | 4P15D30-2 | 17.45 |
| 4P5D40-2 | 8.94 | 4P10D40-2 | 4.17 | 4P15D40-2 | 16.87 |
| * Results that could not be calculated by the model, because Tc > Tf. | |||||
Table 2 shows that the mathematical model of Bungey, Millard, and Grantham (2006) could be applied to calculate the depth of cracks in 88.5% of observations. For the remaining percentage, 11.5%, it was not possible to determine the depth because the wave propagation time in the cracked region was less than the time in the uncracked region, making the model impossible to apply.
Analysis of the results from the series using the descriptive statistics are presented in Table 3.
| Statistics of the results | Actual depth (h) | ||
| Series I (5 cm) | Series II (10 cm) | Series III (15 cm) | |
| Minimum value | 2.67 | 4.17 | 5.92 |
| Maximum value | 15.21 | 11.60 | 27.28 |
| Mean | 6.96 | 7.31 | 15.35 |
| Median | 5.78 | 6.86 | 14.64 |
| Variance | 15.03 | 3.83 | 36.47 |
| Standard Deviation | 3.88 | 1.96 | 6.04 |
| Coefficient of variation | 55.72% | 26.78% | 39.34% |
| Number of observations | 30 | 24 | 31 |
It can be seen from the results that the model presented significant variation for all three series. Series III (15 cm) presented the highest variance and standard deviation in comparison to the other series, showing a high level of dispersion in the data set. Series II (10 cm) had the best indices in the analysis of the dispersion of the data, presenting smaller variance, standard deviation, and coefficient of variation. Series I (5 cm) had an intermediate level of dispersion, but the coefficient of variation was higher, as the standard deviation represented about 55% of the mean.
Pinto et al. (2010) also studied the estimated depth of cracks in concrete blocks, analyzing four different depths (50 mm, 75 mm, 100 mm and 150 mm), with test execution distances of 100 mm and 150 mm, applying the same mathematical model and arrived at the estimates presented in Figure 8, where the tests were identified by the series, then the depth, and then by the test specimen analyzed. For example, S1-75-B indicated Series 1, depth 75 mm, block B.
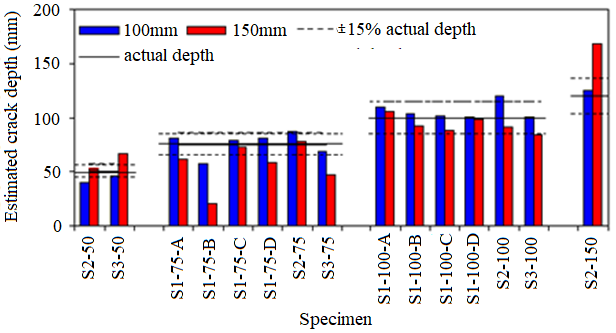
The authors concluded that the results were mostly within the margin of error of 15% of the actual crack depth. A similar result occurred in this study, where the best results were found for crack depths of 10 cm.
To facilitate the understanding of the behavior of the results found, the boxplot of the three series was used in Figure 9, a graphical statistical tool that represents the variation of the data of a numerical variable through quartiles.
A boxplot is formed by drawing a box parallel to the axis of the variable. The lower edge represents the 1st quartile, the thick line the median (2nd quartile), and the upper edge the 3rd quartile. The line that extends vertically indicates the upper and lower limit of the data. This box represents 50% of the central values of the distribution. The flatter the box, the less scattered the data is.
It can be seen that the data from Series II (10 cm) were those with least variability, as data from Series III (15 cm) had greater dispersion. It can be said that the data from Series II (10 cm) behaved better in comparison to the other series in the analysis of descriptive statistics.
To complement the analysis, inferential statistics were used, with the application of a confidence interval (CI) of 95%. This refers to a numeric interval around the mean that will contain 95% of the values, on average. The CI value represents, more or less, a margin of error in relation to the mean.
For this study, a 20% margin of error was considered acceptable. Using the actual crack depth measurement as a reference, this implies margins of error of 1 cm for Series I, 2 cm for Series II, and 3 cm for Series III.
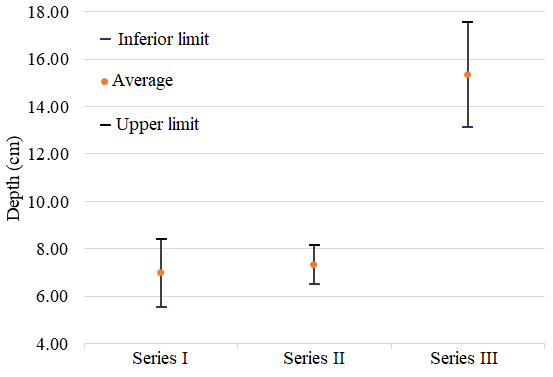
Table 4 shows the confidence intervals of the depth variable for the 3 series analyzed. Figure 10 shows the graphs of the confidence intervals for each series regarding depth.

| Series | C.I. (error) | Lower limit | Mean | Upper limit | |
| Series I | 1.45 | 29% | 5.51 | 6.96 | 8.40 |
| Series II | 0.83 | 8% | 6.48 | 7.31 | 8.14 |
| Series III | 2.22 | 15% | 13.14 | 15.35 | 17.57 |
Corroborating what was determined in the descriptive analysis, the data from Series III (15 cm) had a higher value for the C.I. than the other series, while Series II (10 cm) had the smallest C.I.
A greater C.I. means that the margin of error that ensures 95% confidence increases, making the interval larger, which can be seen in Table 4.
With too large a range, meaning a high margin of error, the application of this procedure on real structures becomes impractical, as it will lead to a great variation in the estimate of the depth of the cracks.
For Series III, the depth variation calculated by the model falls within the range of 13.14 cm to 17.57 cm, with the actual depth being 15 cm.
In Series II, which had the smallest C.I., the depth calculated by the model varies from 6.48 cm to 8.14 cm. Although this is a small interval, the actual depth measurement of 10 cm does not fall within it, a fact that compromises the application of the model.
For Series I, which had an intermediate C.I., with crack depths calculated by the model ranging from 5.51 cm to 8.40 cm, the actual depth of 5 cm also lies outside the range.
It is also possible to see from the results that, for larger distances between the transducers (30 and 40 cm), there is a greater variation of the data, whereas the smaller test execution distances (10 and 20 cm) had less dispersion and a smaller margin of error.
It is possible to apply the proposed model and determine the depths of cracks, but with a high degree of dispersion in the results. This high variability is mainly due to concrete that is not homogeneous, where the wave propagation velocity can vary. It is also possible that the propagation path of the wave may differ from the ideal path considered by the model.
FINAL CONSIDERATIONS
In the current study, an experiment was carried out to statistically evaluate the efficiency of the ultrasound method for the estimation of crack depth.
The test provides clear information on crack detection in concrete, since the wave propagation time is considerably longer than that in areas of intact concrete.
The estimation of crack depth using the model proposed in the literature made it possible to find values for a large percentage of the observations made. However, the values are widely dispersed, and have a high margin of error, compromising the results and the ability to apply the model in the field.
Combining this test with other nondestructive tests may provide better characterization of these defects and more information, in this way eliminating some of the uncertainties presented by the ultrasound method alone.
Acknowledgements
The authors would like to thank CAPES (Coordination for the Improvement of Higher Education Personnel) for their financial support.
REFERENCES
ABNT - Associação Brasileira de Normas Tecnicas (2009), “NBR 7211: Agregados para concreto - especificação” (Rio de Janeiro, Brasil: ABNT).
ABNT - Associação Brasileira de Normas Tecnicas (1996), “NM 58: Concreto endurecido - Determinação da velocidade de propagação de onda ultrassônica” (Rio de Janeiro, Brasil: ABNT).
ABNT - Associação Brasileira de Normas Tecnicas (2013), “NBR 8802: Concreto endurecido – Determinação da velocidade de propagação de onda ultrassônica” (Rio de Janeiro, Brasil: ABNT).
Aggelis, D. G., Kordatos, E. Z., Soulioti, D. V., Matikas, T. E. (2010), “Combined use of thermography and ultrasound for the characterization of subsurface cracks in concrete”, Construction and Building Materials, V. 24, No. 10, pp. 1888-1897. DOI: https://doi.org/10.1016/j.conbuildmat.2010.04.014
Bagavathiappan, S., Lahiri, B., Saravanan, T., Philip, J. (2013). “Infrared thermography for condition monitoring – A review”, Infrared Physics & Technology, V.60, No. 1, pp. 35-55. DOI: https://doi.org/10.1016/j.infrared.2013.03.006
Bungey, J. H., Millard, S. G., Grantham, M. G. (2006), “Testing of concrete in structures” (Oxon, United Kingdom: Taylor & Francis), p. 353.
Controls Group (2017), “Catálogo técnico do medidor de pulso ultrassônico”. Disponível em: < http://www.controls-group.com/eng/concrete-testing-equipment/ultrasonic-pulse-velocity-tester.php >. Acesso em 06 de janeiro 2018.
Dabous, S., Yaghi, S., Alkass, S., Moselhi, O. (2017), “Concrete bridge deck condition assessment using IR Thermography and Ground Penetrating Radar technologies”, Automation in Construction, V.74, pp. 340-354. DOI: https://doi.org/10.1016/j.autcon.2017.04.006
Hair, J. F., Black, W. C., Babin, B. J., Anderson, R. E., Tatham, R. L. (2009) “Análise Multivariada de Dados”. BOOKMAN, 6 ed. Porto Alegre, Brasil, p. 688.
In, C. W., Arne, K., Kim, J. Y., Kurtis, K. E., Jacobs, L. J. (2017), “Estimation of Crack Depth in Concrete Using Diffuse Ultrasound: Validation in Cracked Concrete Beams”, Journal of Nondestructive Evaluation, V.36, No.4. DOI: https://doi.org/10.1007/s10921-016-0382-4
Lee, F. W., Chai, H. K., Lim, K. S. (2016). “Assessment of Reinforced Concrete Surface Breaking Crack Using Rayleigh Wave Measurement”, SENSORS, V.3, No. 3, 337. DOI: https://dx.doi.org/10.3390/s16030337
Lorenzi, A., Reginato, L. A., Lorenzi, L. S., Silva Filho, L. C. P. (2016), “Emprego de ensaios não destrutivos para inspeção de estruturas de concreto”, Revista IMED, V.3, No. 3, pp. 3-13. DOI: https://doi.org/10.18256/2358-6508/rec-imed.v3n1p3-133
Lorenzi, A., Reginato, L. A., Favero, R. B., Chies, J. A., Caetano, L. F., Silva Filho, L. C. P. (2013), “Tomografia Ultrassônica 3D para Avaliação de Estruturas de Concreto” Techne: Revista de Tecnologia da Construção (São Paulo), v. 198, p. 36-44, 2013. Disponível em: < http://techne17.pini.com.br/engenharia-civil/198/artigo296324-1.aspx >. Acesso em 18 de setembro 2018.
Maran, A. P., Menna Barreto, M. F. F., Rohden, A. B., Dal Molin, D. C. C., Masuero, J. R. (2015), “Análise da espessura do cobrimento de armadura em lajes com diferentes distanciamentos entre espaçadores e pontos de amarração”, Revista IBRACON de Estruturas e Materiais, V.8, No. 5, pp. 625-643. DOI: http://dx.doi.org/10.1590/S1983-41952015000500005
Menezes, V. S., Ferronatto, D. N. L., Santos, E. M., Feiteira, J. F. S. (2016), “Estudo do comportamento da porosidade de pasta de cimento por ultrassom” in: Congresso Brasileiro de Cerâmica, 60. Águas de Lindóia: IBRACON (Brasil), Disponível em:< http://www.metallum.com.br/60cbc/anais/PDF/06-048TT.pdf >. Acesso em 06 de janeiro 2018.
Mohamad, G., Carmo, P. I. O., Oliveira, M. J. D., Temp, A. L. (2015), “Métodos combinados para avaliação da resistência de concretos”, Revista Matéria, V.20, No. 1, pp. 83-99. DOI: http://dx.doi.org/10.1590/S1517-707620150001.0011
Pacheco, J., Bilesky, P., Morais, T. R., Grando, F., Helene, P. (2014), “Considerações sobre o Módulo de Elasticidade do concreto” in: Congresso Brasileiro do Concreto, 56, Natal: IBRACON (Brasil), (2014). Disponível em:< http://www.phd.eng.br/wp-content/uploads/2014/06/269.pdf > . Acesso em 06 de janeiro 2018.
Pinto, R. C. A., Medeiros, A., Padaratz, I. J., Andrade, P. B. (2010) “Use of Ultrasound to Estimate Depth of Surface Opening Cracks in Concrete Structures”, E-Journal of Nondestructive Testing and Ultrasonics, V.8, p. 1-11.
Possani, D., Rodrigues, D., Correia, F., Morais, D. (2017), “Ondas ultrassônicas: teoria e aplicações industriais em ensaios não-destrutivos”, Revista brasileira de física tecnológica aplicada, V.4, No. 1, p.16-33. DOI: http://dx.doi.org/10.3895/rbfta.v4n1.5073
Rehman, S., Ibrahim, Z., Memon, S., Jameel, M. (2016), “Nondestructive test methods for concrete bridges: A review”, Construction and Building Materials, V.107, No. 15, pp. 58-86. http://dx.doi.org/10.1016/j.conbuildmat.2015.12.0111
Rocha, J. H. A., Póvoas, Y. V. (2017), “A termografia infravermelha como um ensaio não destrutivo para a inspeção de pontes de concreto armado: Revisão do estado da arte”, Revista ALCONPAT, V.7, No. 3, p.200-2014. DOI: http://dx.doi.org/10.21041/ra.v7i3.223
Seher, M., In, C. W., Kim, J. Y., Kurtis, K. E., Jacobs, L. J. (2013), “Numerical and experimental study of crack depth measurement in concrete using diffuse ultrasound”, Journal of Nondestructive Evaluation, V.32, No. 1, p.81-92. DOI: http://dx.doi.org/10.1007/s10921-012-0161-9
Silva Filho, L. C. P., Helene, P. R. L. (2011), “Análise de estruturas de concreto com problemas de resistência e fissuração” in.: ISAIA, Geraldo C. Concreto: Ciência e Tecnologia, 1Edição, São Paulo: Editora IBRACON (Brasil), pp. 1124-1174.
Souza, G. B. (2016), “Avaliação do método de propagação de onda ultrassônica na determinação da profundidade de fissura em concreto”, Dissertação de mestrado em engenharia civil, Universidade Católica de Pernambuco, p. 155.
Tomazeli, A., Helene, P. R. L. (2017), “Diretrizes para a inspeção em estruturas de obras paralisadas”, Revista Estrutura, 4 ed, p. 30-37. Disponível em: < http://abece.com.br/Revista_estrutura/Edicao4/files/assets/basic-html/page30.html >. Acesso em 20 de setembro 2018.
Wolf, J., Pirskawetz, S., Zang, A. (2015) “Detection of crack propagation in concrete with embedded ultrasonic sensors”. Engineering Fracture Mechanics, V.146, p. 161-171. DOI: https://doi.org/10.1016/j.engfracmech.2015.07.058
Author notes
marcelajtavares@hotmail.com
Additional information
Cite as: M. T. A. Silva, J. H. A. Rocha, E.
C. B. Monteiro, Y. V. Póvoas, E.R. Kohlman Rabbani (2019), "Evaluation of the ultrasound test for estimating the depth of cracks in
concrete", Revista ALCONPAT, 9 (1), pp. 79 –
92, DOI: http://dx.doi.org/10.21041/ra.v9i1.289
Legal Information: Revista ALCONPAT is a quarterly publication by the Asociación Latinoamericana de Control de Calidad,
Patología y Recuperación de la Construcción, Internacional, A.C., Km. 6 antigua
carretera a Progreso, Mérida, Yucatán, 97310, Tel.5219997385893, alconpat.int@gmail.com,
Website: www.alconpat.org
Responsible editor: Pedro
Castro Borges, Ph.D. Reservation of rights for exclusive use
No.04-2013-011717330300-203, and ISSN 2007-6835, both granted by the Instituto
Nacional de Derecho de Autor. Responsible for the last update of this issue,
Informatics Unit ALCONPAT, Elizabeth Sabido Maldonado, Km. 6, antigua carretera a Progreso, Mérida, Yucatán, C.P. 97310.
The views of the authors do
not necessarily reflect the position of the editor.
The total or partial
reproduction of the contents and images of the publication is strictly
prohibited without the previous authorization of ALCONPAT Internacional
A.C.
Any dispute, including the
replies of the authors, will be published in the third issue of 2019 provided
that the information is received before the closing of the second issue of 2019.